How stablecoins are changing money flows
Oct 20•9 min read

In this patch of your weekly Dispatch:
- The busy stablecoins market
- Altcoin ETFs: flows and trends
- Inflation: Expectations and reality
Market cast
BTC: Price stays in range with cooling momentum
On the weekly chart, bullish momentum continues to ease. The Stochastic, a momentum oscillator, is turning down from overbought territory, which could signal momentum exhaustion, and the histogram of the MACD, a trend and momentum indicator, has started to decline. The price is still holding above $80,000 on a weekly closing basis, despite a brief dip below it last week. The RSI, another momentum oscillator, is neutral, and the ADX, which measures trend strength, is close to levels typical of a range-bound market.
On the daily chart, the price is sitting on the 50-period simple moving average (SMA), a level that has been tested many times and continues to act as dynamic support. The next test on the upside is the middle Bollinger Band, a volatility-based indicator that tracks the 20-period SMA. The RSI is neutral, while the Stochastic is at very low levels. The ADX is low and falling, which is typical when there is no strong trend.
Key levels to watch: on the downside, support sits at the round $80,000 level, followed by the $75,000-$76,000 zone, with the 50-period daily SMA also acting as dynamic support. To the upside, resistance comes in around $84,000, followed by $87,000.
The big idea
How stablecoins are scaling in 2026
Twelve months ago, Bitcoin peaked above $126,000 and the stablecoin market stood at about $300 billion. By the end of June, Bitcoin had retraced substantially, but it has still recovered above $80,000. Through all of it, the stablecoin market barely moved: roughly $300 billion at the peak, at the low and today. Beneath that stillness, use kept growing. Daily active addresses on USDT and USDC are up 61% on a year ago, per Glassnode. Blockchain analytics firm Allium estimates end-user payments reached $482 billion through September, up 45%, while supply rose 0.4%.
That gap between a flat balance sheet and rising activity defines the market. Standard Chartered has moved its $2 trillion forecast from 2028 to 2030, citing weak crypto activity. Five trends show what is changing, and where it points.
Stablecoin volume is outrunning supply: Combined daily active addresses on USDT and USDC averaged about 490,000 over the past 30 days, roughly four times the level two years ago. Address counts are not unique users, and growth has been flat since January. Allium counts more than 1 billion payments through September, up 71%, faster than their value, so the average payment is getting smaller, which fits everyday use. Stablecoin card spending reached $3.9 billion, ten times the prior year, though it remains about 0.03% of a major card network’s volume. Raw transfer figures overstate activity. Allium classifies just 2.5% of $97.9 trillion in raw transfers as end-user.
Stablecoin paymentare cheaper and faster, with gaps: A third-quarter report from a stablecoin payments network finds that a $200 remittance over stablecoin rails cost a median of 1%, against 6.36% for traditional remittances on World Bank data. That is about 84% cheaper, although the comparison sets 2026 pricing against 2025 figures, and the network has a commercial interest in the result. The same report puts a $10,000 business transfer to the eurozone at a median of $52, against $135 to $150 for a bank wire. Payouts reached local accounts in two to three minutes in Brazil, Mexico and Colombia, where SWIFT typically settles the next business day.
Reliability is the open item. Completion rates ranged from 98.6% in Mexico to 73% in Costa Rica. A payment needs a stablecoin balance only for the minutes it takes to settle, so more, cheaper, faster payments can add traffic without adding much to the amount sitting still.
Stablecoins now compete for cash: A BIS working paper published last week finds that higher bank deposit rates were followed by slower stablecoin growth. The effect was stronger for USDC than for USDT and did not appear in other cryptocurrencies. Stablecoins are held as a cash alternative, weighed against what a bank pays. The paper’s sample ends in June 2025, so it cannot explain the current plateau, and it does not show that stablecoins reduce total deposits or lending. Banks are competing on two fronts, deposit pricing and product, with coalitions in the US and Europe building their own stablecoins and tokenized deposits.
The field is widening: USDT and USDC still hold about 85% of supply, the same share as a year ago, per Glassnode. Outside them, supply is flat at about $43 billion a year ago and $44 billion now, but not static. Several newer reserve-backed coins more than doubled, while a synthetic coin lost more than half its supply. Reuters reports that issuers are expanding into about 40 emerging markets. Card networks and payment processors added stablecoin balances, cards and payout prefunding to existing products last week.
Where this is heading: The US GENIUS Act is due to take effect in January 2027. Standard Chartered expects its implementation, and any similar rules abroad, to shape how much competition bank-backed and multi-issuer coins bring to the incumbents.
Supply shows how much money sits in stablecoins. Usage shows how often it moves, and balances can stay flat while that traffic builds. For the two to converge, three things matter. Crypto markets could recover and restart issuance, which Standard Chartered notes has followed past plateaus. Deposit pricing could keep shaping where cash goes. New entrants and clearer rules could bring in balances that are not here today. The answers will show up first in total supply, active addresses and end-user payment volume. For now, the market is a flat line with a great deal moving beneath it, at lower cost and in less time than traditional rails, on the evidence so far.
Bitcoin
Bitcoin holds its ground as macro data bites
Bitcoin tested $80,000 last week. Hot inflation data, with producer prices up 6.3% over 12 months, pushed it to its lowest level since mid-September. It has recovered to about $82,000, roughly a third below its October 2025 peak.
The floor looks firmer than the headlines suggest. According to Glassnode, this downturn never closed below the average price paid by all holders, long-term holders have largely stopped selling at a loss, and holders in profit now spend about four coins for every one spent at a loss, a balance seen in past recoveries. Last week’s dip briefly took Bitcoin under $81,500, the average price paid by US spot ETF investors, and it has since recovered above it.
Above, the picture is heavier. Buyers from the past two years sit near break-even around $88,000 and have halted two rallies this year, and the ETFs have been net sellers since October 7. The Fed meets next week, on October 27 to 28.
Altcoin complex
A rally pauses, the build-out continues
Altcoins enter the week on the back foot. An estimated $134 billion has left the group in the past 15 days, and nearly half of exchange-listed tokens now trade below their 200-day average. Bitcoin’s share of total crypto value has risen to about 60% by some measures.
Institutional holders have not rushed for the exit. US spot ether funds lost $542 million in the week to October 9, but cumulative inflows still stand at about $13 billion and the funds are up about $930 million this year. Solana funds ended a record 14-week inflow run yet retain about $1.6 billion in net inflows, and XRP funds’ first weekly outflow in 13 weeks, last week, was just $1.8 million.
The networks keep building. Solana’s Alpenglow upgrade, scheduled for Wednesday, aims to cut finality from about 13 seconds to 150 milliseconds, and Ethereum’s Glamsterdam is in testing. Solana already holds $15.5 billion in dollar stablecoins.
TradFi trends
Chip stocks stumble after a strong run
For much of 2026, AI has been one of the market’s strongest themes, with chipmakers at its center. Last week, that run hit a sharp reversal.
The Philadelphia Semiconductor Index fell for eight straight sessions through Friday, October 16, its longest losing streak since 2008 by most accounts. It lost about 16%, wiping more than $1 trillion from chipmakers’ market value. Doubts over AI spending, after the Financial Times reported that OpenAI’s annualized revenue was near $50 billion against a roughly $70 billion figure that had circulated, and September inflation of 3.7%, which revived rate-hike bets, drove the sell-off. A 5.5% drop in South Korea’s KOSPI on October 13 added to the pressure.
Demand is not the problem. TSMC’s third-quarter profit rose 68.7%, yet its US-listed shares fell. The pressure points are funding costs and expectations.
The week's most interesting data story
Bitcoin shrugs off the Fed, flinches at inflation surprises
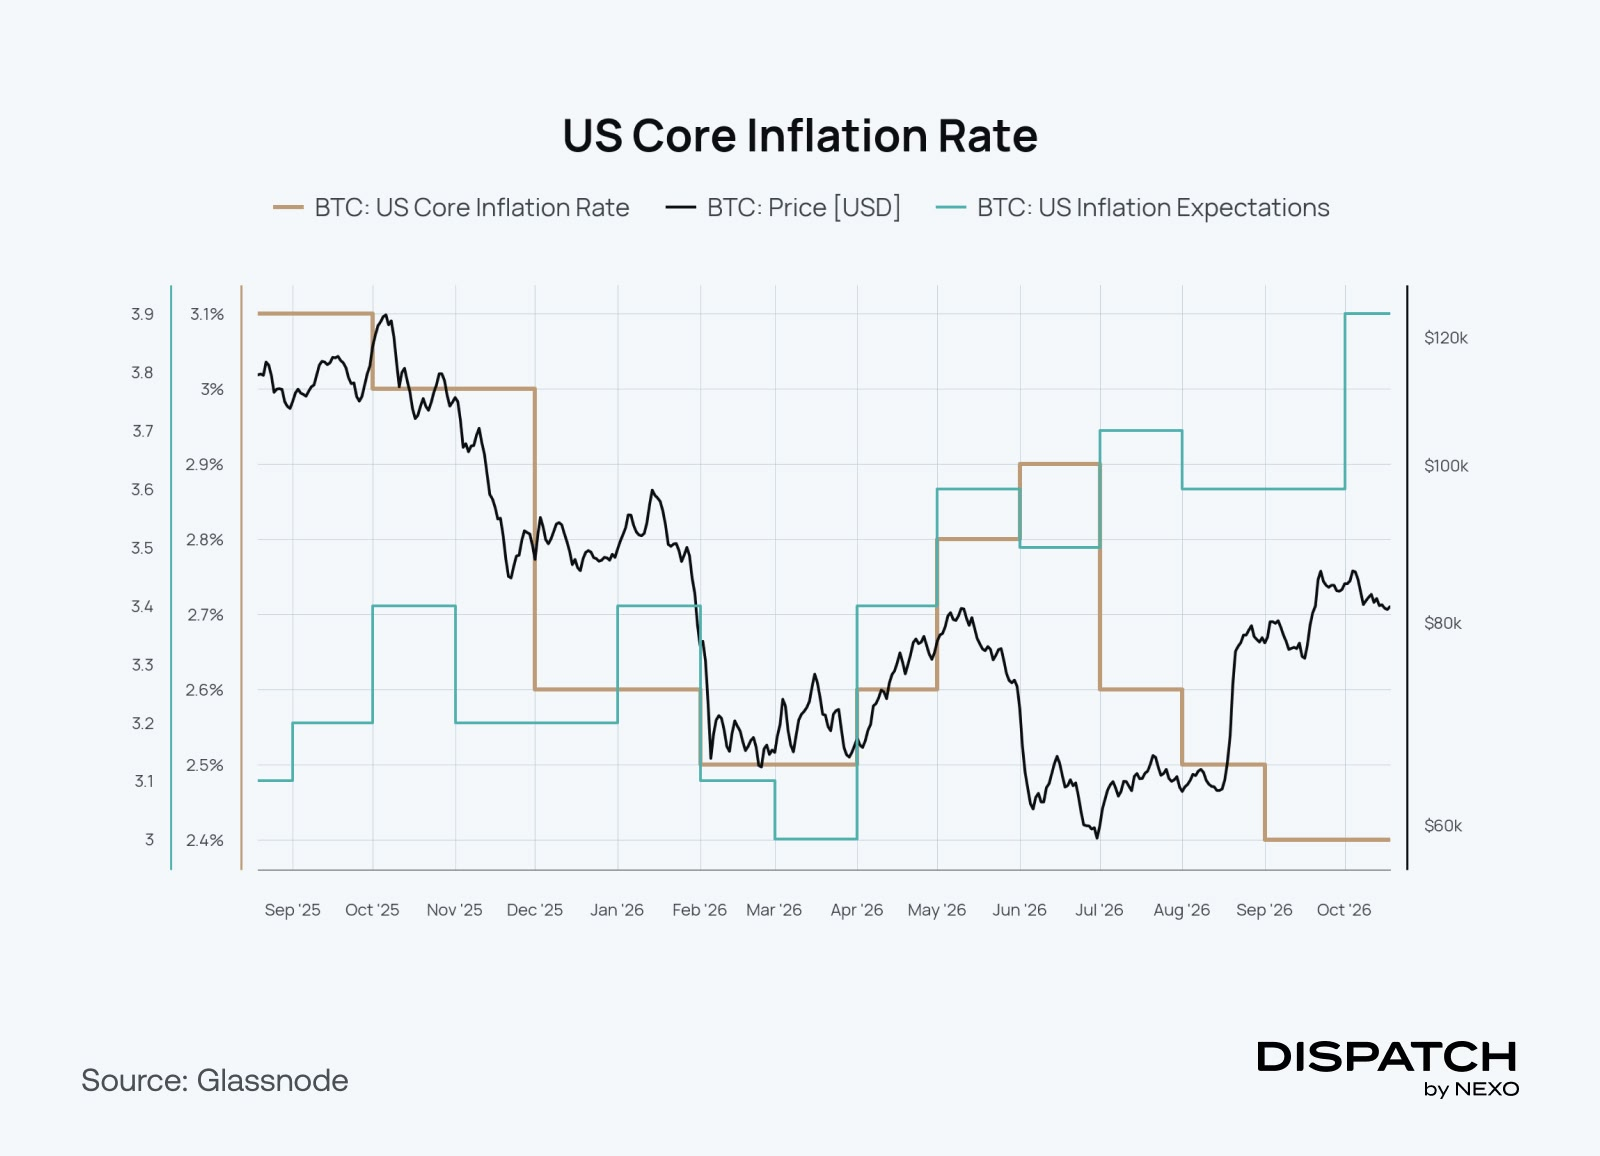
Bitcoin has had two very different reactions to tightening. When the Fed raised rates a quarter point on September 16, it barely dipped and stood more than a tenth higher a week later, according to Glassnode. When September inflation came in above forecasts last week, it dipped within minutes, and hot producer prices pushed it below $80,000 before it recovered to about $82,000.
The difference is expectations. Core inflation is a modest 2.6%, but household inflation expectations have climbed to their widest gap over it in three years, and headline inflation of 3.7% is energy-led. So far, Bitcoin has absorbed the moves markets expected and flinched at the ones they did not, recovering each time. The next test is the Fed meeting on October 27 to 28, where markets price about an 85% chance of a hold.
The numbers
The week’s most interesting numbers
$39.2 billion – Tokenized real-world assets held onchain as of October 16, per RWA.xyz.
85% – Drop in long-term Bitcoin holders’ realized losses since August 12, per Glassnode.
20,338 – Bitcoin wallets holding 10 to 10,000 BTC, an all-time high, per Santiment.
Hot topic
What the community is discussing
Is AI a cause for concern in markets?
Thankfully, Black Monday was evaded.
The final step before the rally continues?
Dispatch is a weekly publication by Nexo, designed to help you navigate and take action in the evolving world of digital assets. To share your Dispatch suggestions and comments, email us at [email protected].
This content is for informational purposes only and does not constitute investment, legal, or tax advice. Crypto assets are highly volatile and their value can go up or down significantly, including to zero. Past performance and historical correlations are not indicative of future results. Nexo has a commercial interest in the adoption of digital assets.
The availability and use of any products or services made available through Nexo US LC (“Nexo US”) are subject to the applicable terms and conditions on the Nexo US platform. This message is for informational purposes only and does not constitute financial, investment, legal, or tax advice. Any decision you make based on this information is solely your responsibility. Nexo US provides the user interface and routes client instructions to third-party service providers. Investment advisory services for eligible digital asset strategies are provided by Gravitalix Financial, LLC (“Gravitalix”), an investment adviser registered with the U.S. Securities and Exchange Commission. Registration with the SEC does not imply a certain level of skill or training. Please review Gravitalix’s Form ADV and related disclosures carefully before investing. Digital assets are not money or legal tender, are not backed by any government or central bank, and are not insured or guaranteed by any governmental or private insurance scheme (including FDIC or SIPC). Any rates, yields, or rewards displayed in the Nexo US app or related materials are subject to change, may be reduced or discontinued at any time, are not guaranteed, and may not be available in all jurisdictions or for all clients. Past performance is not indicative of future results.
Digital Asset services are provided by Bakkt Financial Solutions I, LLC (NMLS ID 1890144) through a software licensing agreement between Bakkt Financial Solutions I, LLC (“Bakkt”) and Nexo US LLC. Bakkt is not a registered broker-dealer and is not a member of SIPC or FINRA. Digital assets are not FDIC- or SIPC- insured. Bakkt Financial Solutions I, LLC is licensed to engage in virtual currency business activity and money transmission by the New York State Department of Financial Services. Digital asset borrowing requires sufficient collateral. Failure to maintain collateral value due to market volatility may result in the liquidation of your assets. Please ensure that you fully understand the risks involved before trading. See here for Bakkt Licenses and Bakkt Disclosures. If you no longer wish to receive marketing communication from us, including product updates, industry news and exclusive promotions, click here.