Inflation: What CPI could change for markets
Oct 13•8 min read
In this patch of your weekly Dispatch:
- Wednesday’s CPI test
- Crypto’s yearly inflows
- BTC’s pullbacks explained
Market cast
BTC: Momentum cools, but support holds
On the weekly chart, bullish momentum has faded slightly, and the coming days and weeks will be decisive for the price direction. The RSI, a momentum oscillator, is neutral, while the Stochastic, another momentum oscillator, is in overbought territory, which could signal momentum exhaustion. The histogram of the MACD, a trend and momentum indicator, is declining but remains in positive territory.
On the daily chart, the price pulled back to the 50-period simple moving average (SMA), which held as strong support. The price has since bounced and is now testing the middle Bollinger Band, a volatility-based indicator. The RSI and the Stochastic are at neutral levels but rising, while the MACD histogram on this timeframe remains below the zero line.
Key levels to watch: on the downside, support sits in the $81,00-$82,000 zone, followed by the round $80,000 level, with the 50-period daily SMA also acting as dynamic support. To the upside, resistance comes in around $87,000, followed by $90,000.
The big idea
Inflation, Fed rates and the market’s road to December
Few data points carry as much weight for markets as the Consumer Price Index (CPI), and this week’s report, due Wednesday, October 14, arrives at a delicate moment. Treasury yields have just touched 24-year highs, the Federal Reserve raised rates in September, and every asset that depends on the cost of money, from bonds and stocks to the dollar and crypto, is waiting to see whether inflation is cooling fast enough to change the Fed’s course.
What CPI is expected to show: Forecasts call for annual inflation of 3.6% in September, up from 3.4% in August. That would reverse part of a recent cooling, after inflation peaked near 4.2% in May. The number matters because it feeds straight into what markets expect from the Fed. Since January 2025, the 2-year Treasury yield, the market’s gauge of the Fed’s path, has moved more on CPI days than on other days, and it has tended to follow the print.
The Fed’s next move: The Fed raised rates by a quarter point in September, to a range of 3.75% to 4.00%, and the minutes released October 7 show most officials expect another increase by year-end. Even so, a pause at the October 27-28 meeting looks likely. Futures put the odds of a hike at about 18%, and Governor Christopher Waller said on October 8 that further hikes “do not need to come at consecutive meetings,” but should come within “an acceptable period of time.”
December is open: If October brings a pause, the next chance to raise rates is the Fed’s December meeting, and that decision is far from settled. Markets already expect more tightening. The 2-year Treasury yield, a gauge of where rates are headed, is near 4.80%, about 0.8 percentage point above the Fed’s current range. But it has slipped about 14 basis points from its late-September high, suggesting traders are less sure. The Fed isn’t making it easier to judge. Chair Kevin Warsh has said inflation must be falling toward 2% “clearly and at sufficient speed,” without saying how fast that is. Until that is clearer, each inflation report is judged by how quickly prices are cooling, not just where they stand.
Weak jobs argue for caution: The Fed has two goals, stable prices and maximum employment. High inflation pushes it toward higher rates, while a weakening job market pushes the other way, because higher rates make hiring harder. In September, U.S. employers added just 29,000 jobs, well short of the roughly 84,000 to 95,000 expected, and unemployment ticked up to 4.2% from 4.1%. The next jobs report comes after the October meeting, so it matters for December, not October. That makes Wednesday’s CPI the swing factor. A hotter reading strengthens the case for a December hike. A cooler one, alongside the weak jobs data, gives officials a reason to wait.
What it means for markets (and Bitcoin): Rates set the price of everything else. When the Fed is expected to keep rates high, cash and Treasuries pay more, which raises the bar for stocks, bonds and other assets. The 2-year yield shows how consistently that plays out on CPI days. On the nine release days since January 2025 when it fell, gold rose on eight and the dollar fell on seven. On the ten days it rose, gold fell on seven and the dollar rose on seven. The tokenized S&P 500 leaned the same way since July 2025: up on four of the five days the 2-year fell, down on five of the eight it rose.
Bitcoin, whose return comes from price rather than a coupon, competes with those alternatives too, but it has not followed the pattern. It rose on five of the nine days the 2-year fell and on seven of the ten days it rose.
What to watch: A pause in October looks likely, but a December hike is not a given. No single report will settle that. But Wednesday’s number is the first real test of whether another hike remains a live possibility or begins to fade, and it is the signal markets will be reading this week.
Macroeconomic roundup
Beyond CPI: what else could move markets
CPI on Wednesday is the week’s main test of the Fed’s path, but it is not the only event that matters. Bank earnings, producer prices, retail sales and two Fed speakers also land before the Fed meets on Oct. 27-28. Bitcoin enters the week near $84,000, after a week of ETF outflows.
Bank earnings (Tuesday–Wednesday): JPMorgan, Goldman Sachs and Citi report Tuesday, then Bank of America, Morgan Stanley and BlackRock Wednesday. A real-economy read alongside the inflation data.
CPI and Beige Book (Wednesday): Annual inflation is forecast at 3.6% for September, up from 3.4%. A hotter print strengthens the case for a December hike; a cooler one weakens it.
Producer prices and retail sales (Thursday): Producer prices are forecast to rise 0.6%, after 0.4%. Firm prices alongside resilient spending would complicate the Fed’s outlook.
Fed speakers (Tuesday and Friday): Governor Waller speaks early Tuesday, and Chair Warsh closes the week on Friday. Any detail on what “sufficient speed” means would matter.
TradFi trends
A soft month for ETFs, a steadier year for flows
Bitcoin ETFs have had a soft October. U.S. spot funds are down a net $386.3 million for the month through Friday, after about $3 billion of inflows in September. Ethereum funds have fared worse, losing $635 million this month and extending their outflow streak to nine straight days. Solana funds are also negative, down $24.8 million after five straight days of outflows.
However, the year-to-date picture is steadier. JPMorgan estimates that about $50 billion has flowed into digital assets so far this year. At that pace, the full-year total would come to roughly $66 billion, up from the $52 billion pace in May but still about half of last year’s roughly $130 billion. The mix is shifting too. Early-year flows came mainly from Strategy’s Bitcoin purchases and venture funding, while since August, ETF flows and institutional futures positioning have improved.
The week's most interesting data story
Could profit-taking explain the pullbacks?
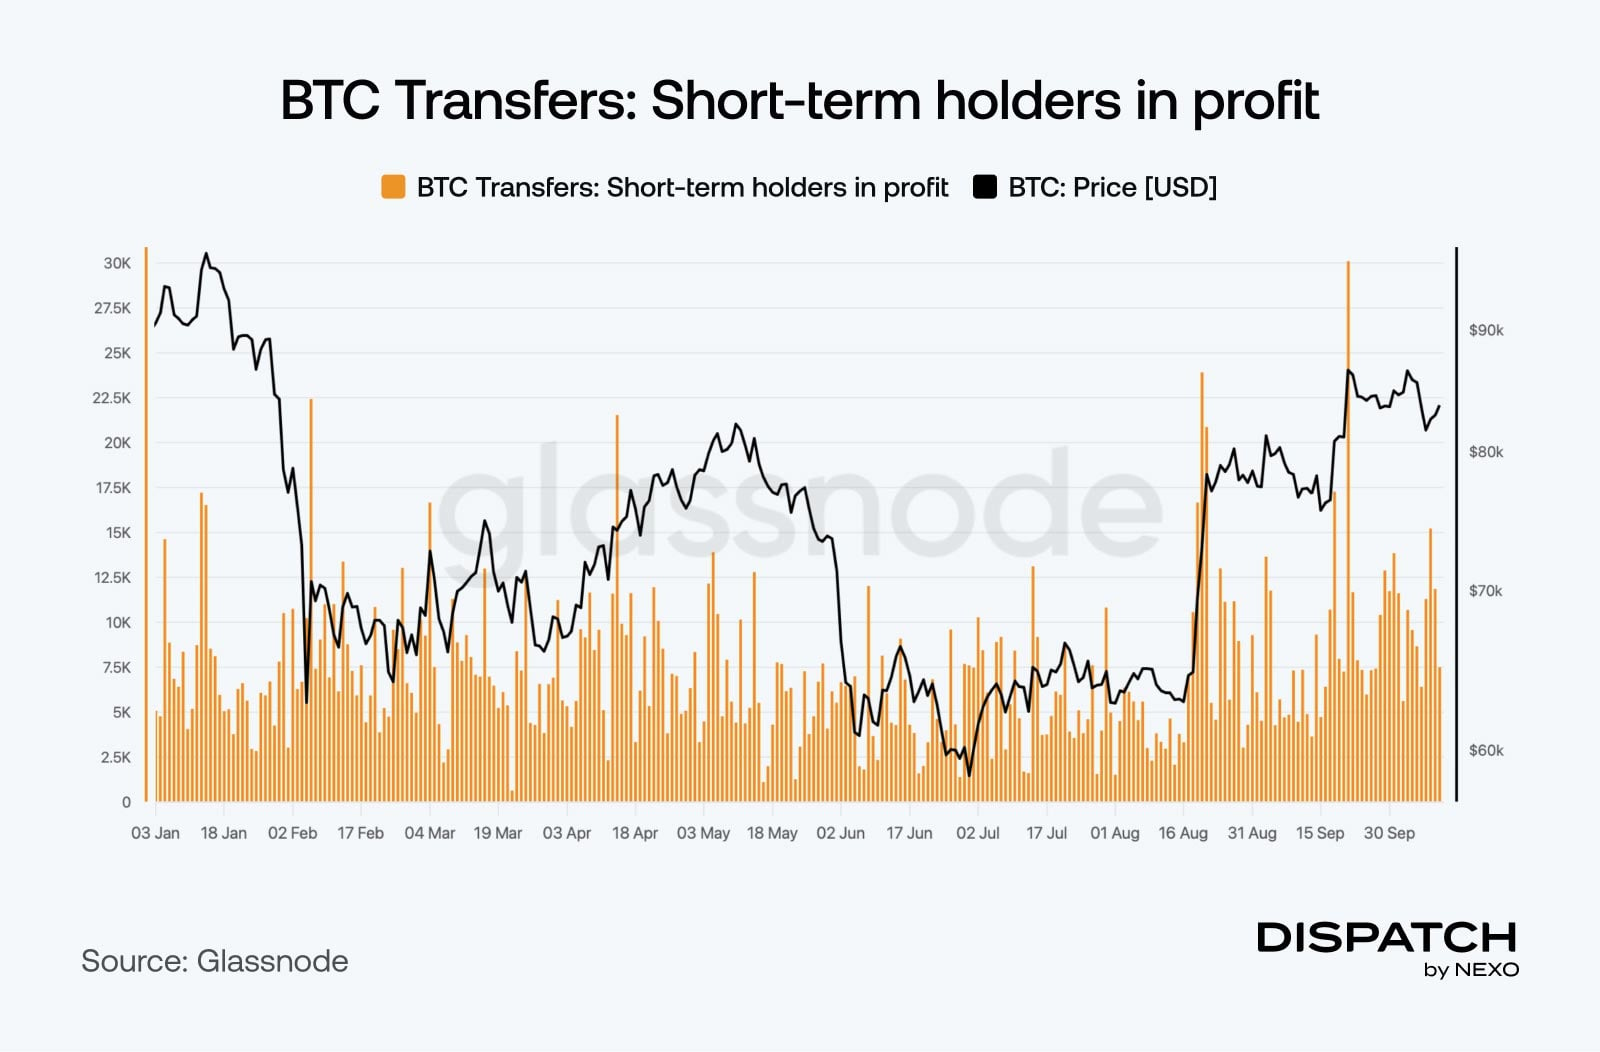
Elevated Treasury yields and a hawkish Fed are the usual explanations for Bitcoin’s pullbacks. But could something simpler be at work: profit-taking?
Bitcoin has closed near $86,500 twice in three weeks, on September 21 and October 4, and both times it was lower a week later, by more than 3%. Both times, short-term holders, those who bought within the past five months, sent unusually large volumes to exchanges at a profit. The September 21 transfer, 30,100 BTC per Glassnode, was the largest in a year. Two cases are a small sample, and transfers do not confirm sales. But the $86,000 area has twice drawn supply from recent buyers.
The numbers
The week’s most interesting numbers
46% – Bitcoin’s annualized volatility this year, down from 84% in 2018, though large daily moves have been more frequent.
200 milliseconds – Solana’s target block time since October 9, when its final upgrade step went live, half the original 400 milliseconds.
$57.6 billion – Cumulative net inflows into U.S. spot Bitcoin ETFs since launch, with $100.6 billion in assets, even after October’s outflows.
Hot topic
What the community is discussing
Are these Bitcoin holders too?
The AI-heavy S&P500 examined.
Would that be a decent dip-buying opportunity?
Dispatch is a weekly publication by Nexo, designed to help you navigate and take action in the evolving world of digital assets. To share your Dispatch suggestions and comments, email us at [email protected].
This content is for informational purposes only and does not constitute investment, legal, or tax advice. Crypto assets are highly volatile and their value can go up or down significantly, including to zero. Past performance and historical correlations are not indicative of future results. Nexo has a commercial interest in the adoption of digital assets.
The availability and use of any products or services made available through Nexo US LC (“Nexo US”) are subject to the applicable terms and conditions on the Nexo US platform. This message is for informational purposes only and does not constitute financial, investment, legal, or tax advice. Any decision you make based on this information is solely your responsibility. Nexo US provides the user interface and routes client instructions to third-party service providers. Investment advisory services for eligible digital asset strategies are provided by Gravitalix Financial, LLC (“Gravitalix”), an investment adviser registered with the U.S. Securities and Exchange Commission. Registration with the SEC does not imply a certain level of skill or training. Please review Gravitalix’s Form ADV and related disclosures carefully before investing. Digital assets are not money or legal tender, are not backed by any government or central bank, and are not insured or guaranteed by any governmental or private insurance scheme (including FDIC or SIPC). Any rates, yields, or rewards displayed in the Nexo US app or related materials are subject to change, may be reduced or discontinued at any time, are not guaranteed, and may not be available in all jurisdictions or for all clients. Past performance is not indicative of future results.
Digital Asset services are provided by Bakkt Financial Solutions I, LLC (NMLS ID 1890144) through a software licensing agreement between Bakkt Financial Solutions I, LLC (“Bakkt”) and Nexo US LLC. Bakkt is not a registered broker-dealer and is not a member of SIPC or FINRA. Digital assets are not FDIC- or SIPC- insured. Bakkt Financial Solutions I, LLC is licensed to engage in virtual currency business activity and money transmission by the New York State Department of Financial Services. Digital asset borrowing requires sufficient collateral. Failure to maintain collateral value due to market volatility may result in the liquidation of your assets. Please ensure that you fully understand the risks involved before trading. See here for Bakkt Licenses and Bakkt Disclosures. If you no longer wish to receive marketing communication from us, including product updates, industry news and exclusive promotions, click here.