The Fed effect: Bitcoin’s next move
Jul 28•7 min read

In this patch of your weekly Dispatch:
- Bitcoin holders persist
- ETH looks for a bottom
- More Big tech earnings
Market cast
BTC: Consolidation holds at key support
The uncertainty hanging over the Fed's decision this week is showing up directly in Bitcoin's charts, which reflect the same wait-and-see mood gripping broader markets. Bitcoin's weekly chart continues to hover around the 200-period SMA, which is acting as strong dynamic support. The RSI, a momentum oscillator, remains neutral without offering a clear signal, while the Stochastic, another momentum oscillator, is nearing oversold territory. The MACD, a trend and momentum indicator, keeps its histogram above the zero line, a mildly constructive sign even as the broader picture stays mixed.
The daily chart shows a similar tug-of-war. Price has bounced off the 50-period SMA, which continues to provide downside support. The RSI sits in neutral territory, while the Stochastic's signal lines are turning downward. The MACD histogram sits slightly below the zero line, and a low ADX reading — a gauge of trend strength — points to the absence of a strong directional trend in either direction.
Key levels to watch: On the downside, support sits around $62,000, with a deeper zone near $58,000; the weekly 200-period SMA and daily 50-period SMA offer additional dynamic support. To the upside, resistance comes in around $67,000, followed by $70,000.
The big idea
Will the Fed serve as a catalyst for Bitcoin
Bitcoin spent last week taking what the backdrop gave it. Tech stocks had a rough stretch, with AI-spending worries and disappointing earnings pulling the Nasdaq lower, but Bitcoin wasn't heavily impacted by the move. A quieter geopolitical mood in the Middle East also eased some inflation anxiety, and together the two gave Bitcoin room to push back above $65,000, holding on to most of the ground it clawed back after bottoming near $57,717 in early July. The question now is whether that ground holds.
The signals: A few indicators are lining up in a way that doesn't happen often. Bitcoin's price against the Nasdaq 100, on a smoothed weekly RSI, recently hit its most stretched level in the pair's 16-year history — beyond the prior extremes of 2015, 2019, and 2022, each of which was followed by meaningful Bitcoin outperformance over the next one to three years. Its realized price, the average onchain cost basis of the circulating supply, sits near $53,000, a level that past bear-market lows have typically touched. And going by the timing of prior cycles, where lows have tended to form around week 60 after the peak, this cycle — now at week 40 — would put a bottom by late November if that pattern holds.
Onchain flows have shifted too. Illiquid supply, coins moving into wallets that historically don't sell, was steadily declining through mid-July but has reversed sharply over the past week, turning into consistent net accumulation.
ETFs have followed a similar arc: after months of outflows, spot Bitcoin ETFs have logged three straight weeks of net inflows ($197 million, $75 million, then $33 million), even as the pace has cooled.
Options positioning tells a similar story. On Deribit, the $70,000 and $72,000 strikes have drawn nearly $5 billion in combined open interest, with calls outnumbering puts more than 10-to-1 at both levels — much of it built on Clarity Act optimism that has since cooled and started to unwind. Futures open interest, meanwhile, has held steady in the $30–33 billion range, without the leverage buildup that typically precedes a flush — generally a healthier base for a sustained move.
The catalyst: The bigger driver has been macro rather than Bitcoin-specific, and this week brings the test. The Fed meets July 28–29, with the decision due Wednesday. The committee looks genuinely split — some officials lean toward higher rates given persistent inflation, others expect price pressures to ease on their own — and Chair Warsh has avoided signaling his stance. Even so, markets are pricing better than 60% odds the Fed holds steady, a fifth straight meeting without a change.
There's also a case building that Bitcoin no longer needs to follow the traditional four-year cycle, which points to a low in September or October with average drawdowns near 80%. A growing view instead treats Bitcoin as more macro-sensitive, with its bear markets tracking rate expectations rather than a fixed calendar — meaning if the Fed holds and growth holds up, the low may already be behind us. The Clarity Act remains a separate factor, with its odds of clearing the Senate before August recess falling from about 51% to 38% this week.
Where this leaves things: A rare oversold reading, a nearby cost-basis level, a cycle-timing pattern consistent with this window, reversing illiquid supply, improving ETF flows, bullish options positioning, and a steady futures market all point in the same direction. Whether they hold may come down to what the Fed says on Wednesday.
Ethereum
Ethereum's quiet case for a bottom
Ether has quietly been building its own recovery case alongside Bitcoin's. It's trading about 17% below its ~$2,300 fair-value cost basis, a level that's historically marked long-term lows, and it's getting cheaper versus Bitcoin too — the ETH/BTC valuation ratio has fallen from near 0.95 last August to about 0.65. Of the five onchain signals analysts track for a cycle bottom, only two have been confirmed so far.
Supply is tightening: exchange withdrawals recently hit a three-year high, a record 34% of ETH is now staked, and top corporate holder Bitmine added 325,000 ETH over the past month. Capital inflows have also picked up, and ETH ETFs have out-earned bitcoin ETFs on inflows for three straight weeks, leading for July overall.
Bottom line: at the moment, ETH appears potentially cheap with tightening supply and fresh capital rotating in — but the bottom isn't confirmed yet.
Macroeconomic roundup
A packed calendar for monetary policies
It's a packed calendar this week, with several data points that could shape sentiment across digital asset markets. Adding to that, three major central banks hand down decisions within days of each other. It’s a packed week:
Fed Interest Rate Decision (Jul 29): A hold remains the favored outcome, though hike odds have swung between roughly 12% and 38% this month as oil rallied.
US GDP & Core PCE (Jul 30): The week's key growth and inflation prints, released together — arguably the most important data point after the Fed decision itself.
Eurozone GDP, QoQ (Jul 30): This week's main Eurozone growth signal.
BoE Interest Rate Decision (Jul 30): Also expected to hold, facing the same inflation-versus-growth tension weighing on other central banks.
BoJ Interest Rate Decision (Jul 31): A hold is expected, but the real signal is in the outlook report and any hint of a faster hiking path.
Eurozone CPI, YoY (Jul 31): This week's main Eurozone inflation signal.
TradFi trends
Big Tech's make-or-break week
Crypto's fortunes this month have moved in tandem with the broader risk-on mood in equities, and this week puts that mood squarely in the hands of Big Tech. Microsoft, Meta, Amazon, and Apple all report earnings, and investors have grown increasingly impatient for proof that massive AI infrastructure spending is paying off — a question that matters well beyond tech, given how much risk appetite across markets, crypto included, has leaned on the AI trade holding up.
Tesla and Alphabet stumbled on exactly this point last week. Tesla missed estimates and flagged higher capex, while Alphabet beat but raised its spending guidance anyway, sending shares down 7%. The Roundhill Magnificent Seven ETF is now down 3% on the year. If the remaining hyperscalers can't convince the market that AI spending still pays off, the pressure could spread well beyond tech, potentially pulling risk sentiment — and crypto along with it — down as well.
The week's most interesting data story
Holders never stopped buying
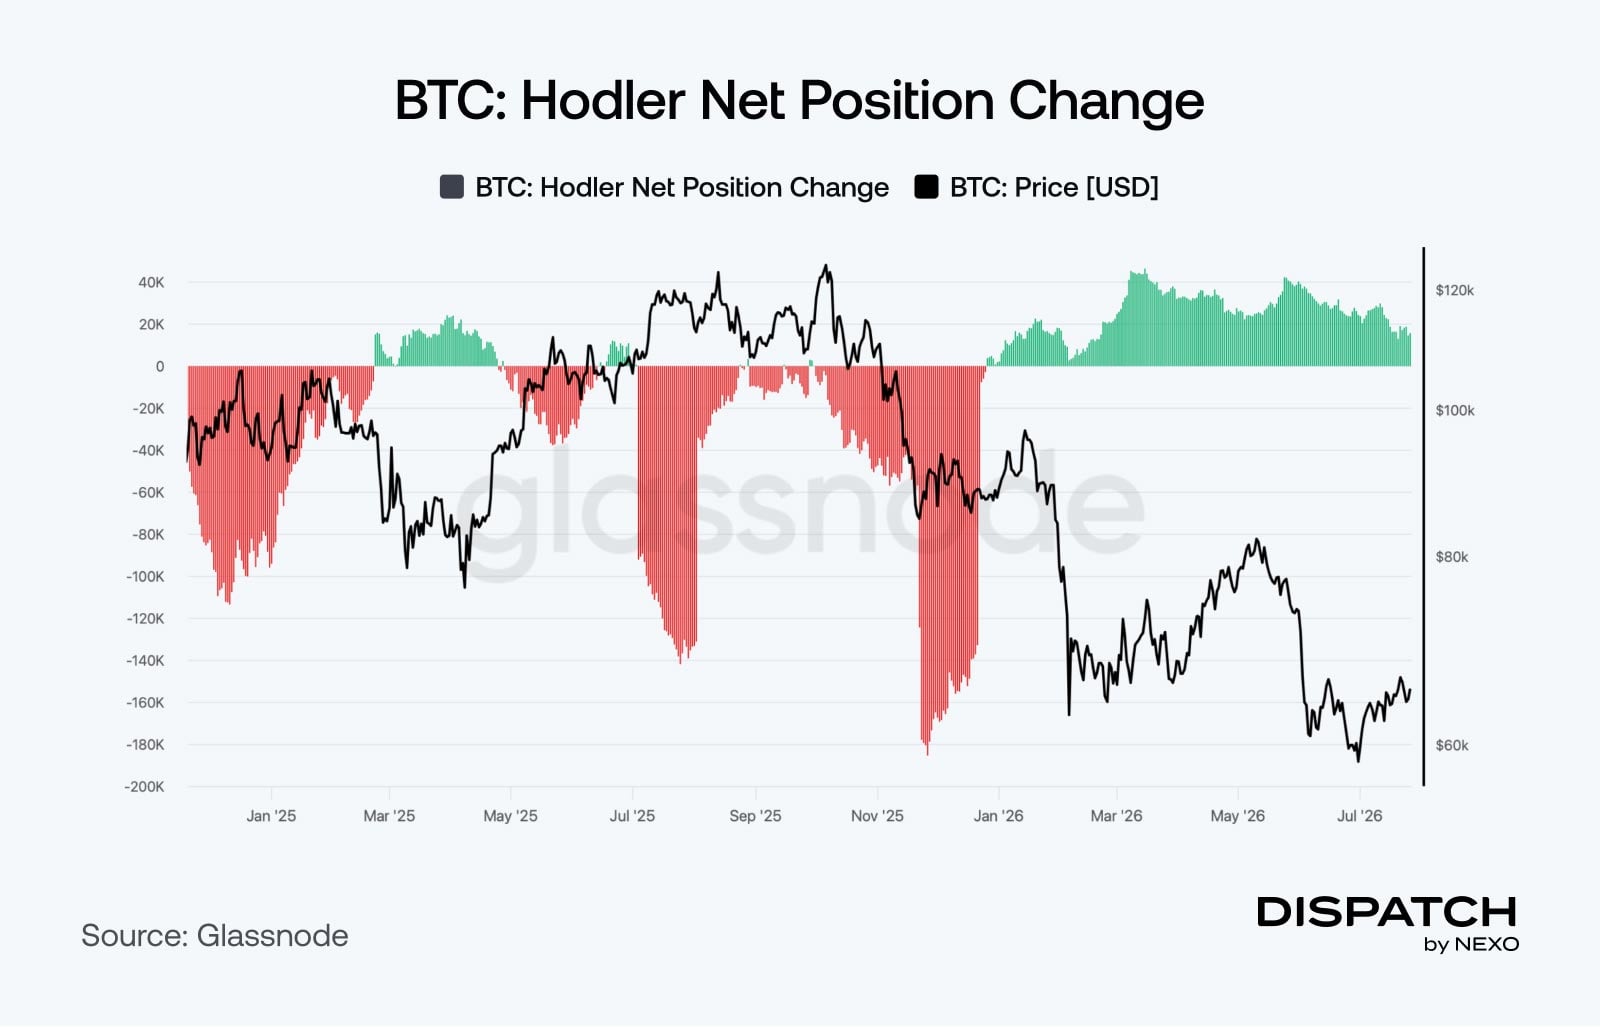
Bitcoin's holder net position change — whether long-term holders are net buying or selling — turned sharply negative during last year's top, with holders offloading up to 180,000 BTC a day as price collapsed from six figures. Since late December, that's reversed: through the entire drop from roughly $90,000 to $57,000, and right on through this summer's choppy, range-bound price action, holders have kept net accumulating almost daily, at times adding over 40,000 BTC. That's the kind of divergence — price stuck in place while holders keep buying underneath it — that has, in past cycles, tended to resolve with price eventually catching up to what holders were already doing.
The numbers
The week’s most interesting numbers
3 — Weeks of spot Bitcoin ETFs' inflows for the longest streak since early May.
65.88% to 34.12% — Calls vs. puts open in the Bitcoin options market, favoring higher prices.
41.04 million ETH — A record 34% of ETH's supply now locked in staking.
48,000 BTC — Accumulated by large wallets over the past month, even as price sits 17% below recent highs.
Over 30% — Share of on-chain crypto transactions now made up by stablecoins, whose market cap has topped $250 billion.
Hot topic
What the community is discussing
Is the biggest whale back in action?
What are U.S. investors up to?
Will the earliest cuts come in 2027?
Dispatch is a weekly publication by Nexo, designed to help you navigate and take action in the evolving world of digital assets. To share your Dispatch suggestions and comments, email us at [email protected].