What is bitcoin's summer flow hiding?
Jun 23•6 min read

In this patch of your weekly Dispatch:
- Wallets accumulate BTC
- ETH rewrites its foundations
- Japanese fund joins crypto
Market cast
BTC’s support in the spotlight
Bitcoin's weekly chart is presenting a picture of cautious resilience. Price has found a footing around the 200-period SMA – a key long-term trend indicator that continues to act as dynamic support beneath current levels. The RSI and Stochastic oscillators, both momentum indicators, remain under pressure – the RSI signal line sits at very low levels without yet crossing into official oversold territory, while the Stochastic signal lines are crossing below the 20 threshold, suggesting that selling pressure may be nearing exhaustion rather than accelerating. The MACD histogram, a trend and momentum indicator, is printing slightly below the zero line, keeping the broader structure cautious but not decisively bearish.
The daily chart tells a steadier story. Price continues to hover around the 20-period SMA, and the overall action on this timeframe looks rangebound – a sign of consolidation rather than deterioration. The RSI and Stochastic oscillators are not offering meaningful signals in either direction, while the MACD histogram holds above the zero line – a constructive reminder that the near-term structure remains intact.
Key levels to watch: On the downside, immediate support sits around $61,000, followed by $59,000, with the 200-period SMA providing an additional layer of dynamic support beneath that. To the upside, the first area of resistance comes in around $64,000, followed by the $66,000–$67,000 zone.
The big idea
Bitcoin’s 2026 summer: Trends and shifts
Bitcoin enters summer the way it often does — quietly. Historically one of the slower seasons for price action, this year's backdrop carries extra weight: a hawkish Federal Reserve under new Chair Kevin Warsh, who scrapped forward guidance at his debut meeting and left markets pricing a 90% chance of a rate hike before year-end, and months of U.S.-Iran tension that kept oil elevated and risk appetite on a short leash. The result is a market in a holding pattern — BTC pinned in a $60,000–$67,000 range, unable to find the conviction for a clean breakout. But range-bound doesn't mean standing still. Beneath the surface, a few dynamics are quietly stacking up.
The geopolitical overhang is lifting — tentatively. The U.S. and Iran agreed on a 60-day roadmap toward a final deal, including a communication line through the Strait of Hormuz to keep commercial shipping moving. Brent crude slid toward $79. The roadmap is not a signed peace deal, and the next two months will test whether it holds — but a durable settlement would remove one of the biggest macro overhangs of the year, easing oil and inflation pressure and historically creating a more supportive backdrop for risk assets including bitcoin.
Long-term holders are taking over: While ETF outflows dominate the headlines, onchain data tells a different story — long-term holders are simply not selling. K33 notes that 79% of bitcoin's circulating supply is now held by long-term holders, a new all-time high, with old coin reactivation in 2026 running at its lowest level since 2012. In every prior bear market, that kind of supply concentration among long-term holders has been a hallmark of the market approaching its trough. For more on what's happening beneath the surface, see this week's data story.
The current drawdown is the shallowest on record. At roughly 50% below its October 2025 all-time high of $126,000, this cycle is tracking well below the 84% peak-to-trough of 2018 and the 77% decline of 2022, according to CryptoQuant. Each successive cycle has brought shallower drawdowns, and the structural reason is no mystery: institutional capital and ETF demand now provide a floor that simply didn't exist in earlier cycles.
Miner economics could set up a supply squeeze. With bitcoin trading well below JPMorgan's estimated production cost of $78,000 and roughly 20% of miners underwater, the flow of newly minted bitcoin entering circulation is slowing. Historically, a compression in new supply alongside any return of demand has been a constructive setup — basic economics that the market may eventually have to reckon with.
Network activity tells a different story than price. Bitcoin's Network Activity Index has risen steadily since January and now sits just 7% below its all-time high, per CryptoQuant — even as prices moved lower. Daily transactions have climbed above 800,000, near the highs of the entire 2023–2025 bull cycle. The underlying network is busier than the price chart would suggest.
History favors buyers at these levels. Kraken's chief economist points out that bitcoin closes below its 200-week moving average — currently near $62,300 — on roughly 10% of trading days since 2017. Buyers at those levels have historically logged median returns above 100% within a year and above 300% within two. The median time to break even on those purchases? Two days.
Choppy summer? Probably. But the ingredients for what comes next are quietly assembling.
Ethereum
ETH’s biggest upgrade since the Merge
While ETH's price has been uninspiring, the development roadmap tells a more exciting story. Glamsterdam — Ethereum's most ambitious upgrade since the 2022 Merge — is in its final testing phase, with a launch expected in the second half of the year.
The upgrade brings block-building fully onchain to curb MEV manipulation, faster and more predictable smart contract execution, and a sweeping gas repricing designed to make Ethereum leaner and ZK-scaling ready. "This will change a lot of assumptions about Ethereum and set us up for much more scaling in the future," said Ethereum Foundation core developer Parithosh Jayanthi.
Ethereum has rarely looked this technically ambitious while trading this cheaply — Glamsterdam could change that equation.
Macroeconomic roundup
A week of Fed signals and key inflation data
Markets head into the final week of June navigating a delicate balance between easing geopolitical tensions and a stubbornly hawkish Fed.
Core PCE (Jun 25): The Fed's preferred inflation gauge — any upside surprise reinforces higher-for-longer.
GDP Final Estimate (Jun 25): The third and final Q1 reading. Revisions are rare but market-moving when they happen.
Initial Jobless Claims (Jun 25): A rising trend would add weight to the case for eventual easing.
FOMC Member John Williams (Jun 25): Permanent policy voter — his remarks land hours after the data dump, making it the week's most consequential moment.
TradFi trends
Japan's pension funds are moving into crypto
A Japanese corporate pension fund is allocating 1% of its $132 million portfolio to crypto in fiscal 2026 — not as a price bet, but as a hedge against dollar weakness and currency debasement. The National Business Corporate Pension Fund's investment chief reached the decision after six years of research, concluding the market had finally matured. The fund will trim yen exposure from 80% to 70%, parking bitcoin alongside gold and emerging-market currencies in a diversification sleeve.
The move doesn't happen in isolation. Japan's three megabanks — MUFG, Mizuho, and SMBC — plan to launch a jointly issued stablecoin this year, a bill classifying crypto as a financial instrument has cleared the lower house, and SBI Shinsei Bank is launching a crypto rewards program for depositors this fall.
Japan's traditional financial sector isn't tiptoeing around crypto anymore — it's building infrastructure around it.
The week's most interesting data story
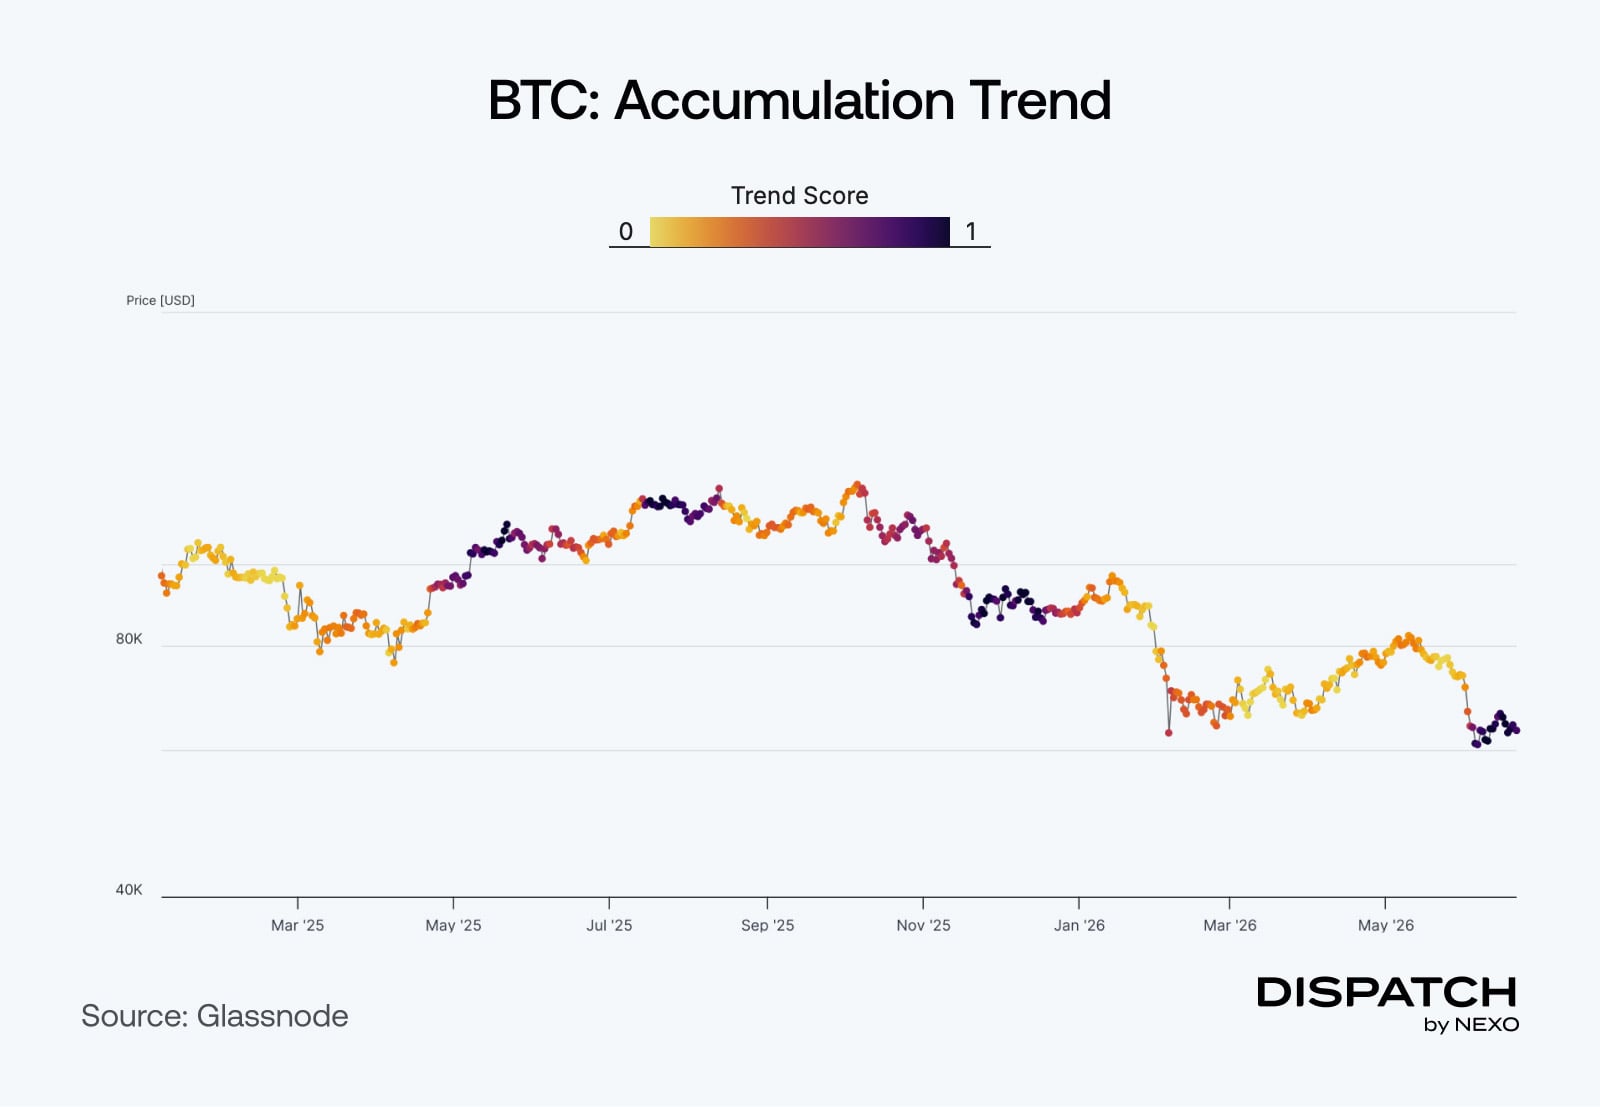
The quiet accumulation of BTC
One of the oldest patterns in bitcoin markets is playing out again — every significant pullback eventually attracts buyers who view depressed prices as an opportunity rather than a warning. Nearly 260,000 BTC were accumulated in the 10 days following bitcoin's dip below $60,000, per Glassnode. The firm's Accumulation Trend Score — which measures buying fervor across wallet sizes — hit 1.0, its maximum reading, and has held there for over two weeks, spanning cohorts from retail all the way up to 1,000-BTC holders. From March through May, those same groups were net sellers. Something quietly shifted at the lows.
The numbers
The week’s most interesting numbers
$35 million — Strategy added another 520 BTC at an average price of about $67,000, bringing total holdings to 847,363 BTC.
6 weeks – U.S. spot Bitcoin ETFs have now posted six consecutive weeks of net outflows, but analysts say the wave is fading.
72,353 — Japan's Nikkei 225 closed at a record high on June 22, up 1.55% on the day.
52,203 ETH — Bitmine added roughly $90 million worth of ETH, bringing total holdings to 5.67 million tokens — 4.7% of the entire Ethereum supply.
Hot topic
What the community is discussing
Bitcoin’s micro-transactions trend explained.
Solana’s gets more institutional recognition.
There is (tokenized) gold on Nexo, you know.
Dispatch is a weekly publication by Nexo, designed to help you navigate and take action in the evolving world of digital assets. To share your Dispatch suggestions and comments, email us at [email protected].