Crypto headwinds: How could the market stabilize?

In this patch of your weekly Dispatch:
- Crypto headwinds
- Bitcoin’s floor and ceiling
- Tokenization heads to Solana
Market cast
BTC: Support zone in focus as the daily chart turns oversold
On the weekly chart, bearish momentum prevails. Price has dropped below the 200-period SMA and is now heading toward the lower Bollinger Band, a volatility-based indicator. The RSI, a momentum oscillator, is at low levels, the Stochastic, another momentum oscillator, has entered oversold territory, and the MACD, a trend and momentum indicator, has seen its histogram turn negative.
On the daily chart, price is hovering around the lower Bollinger Band and currently sits below most of the major SMAs. Both the RSI and the Stochastic are in oversold territory, and a move back above the oversold threshold would signal fading bearish momentum. The MACD histogram remains deep below the zero line.
Key levels to watch: On the downside, immediate support sits in the $62,000-$63,000 zone, with the next level near $58,000 — the daily lower Bollinger Band also lends dynamic support. To the upside, resistance comes in around $67,000, followed by the $70,000-$71,000 zone.
The big idea
Crypto meets macro: What would signal stabilization
Crypto absorbed a tough week as several headwinds converged and reinforced one another. Glassnode data shows Bitcoin fell as much as 17% from last Sunday’s close to $62,000, its weakest level since July, then rebounded to near $65,400 by the weekly close, down 13% on the week. Ether, XRP and Solana fell similarly; over the month, Bitcoin is down about 20% and the three altcoins 24% to 30%.
What would signal stabilization: A low is only visible in hindsight, so the useful question is what evidence would build the case. Four indicators have started to improve, beginning with leverage. Funding rates, the fee longs pay to hold leveraged exposure, fell to about a quarter of their late-October level and dipped slightly negative on some large exchanges, so the crowded optimism behind the weekend liquidations has eased. Funding alone is not a reliable signal, though: in mid-January it turned negative near $95,000, and Bitcoin fell about 30% over the next month.
With leverage thinner, a washout among recent buyers is underway. The average buyer of the past five months paid about $75,600, and on Saturday nearly all of that group’s coins were in loss, the highest share since July. On-chain data from Glassnode suggests many bought the September rally near $80,000. In past cycles, such phases have seen weaker hands exit and supply pass to stronger ones, though that is not assured, and June’s low was deeper, so the process may not be complete.
Valuation offers a wider lens. Bitcoin’s MVRV ratio, which divides its market cap by its realized cap, the value of every coin at the price it last moved, is near 1.2, close to June’s 1.1 low. The 2018, 2020 and 2022 lows came below 1, so valuation is approaching, but has not reached, the levels that marked those lows. The average cost of all coins, near $53,700, is the next reference level, not a guaranteed floor. Holder behavior points the same way: wallets of 1,000 BTC or more added roughly 39,000 BTC over two weeks, while wallets holding 100 to 1,000 BTC sold about 46,000.
Three signals would add confirmation: spot demand (an end to the ETF outflow streak and growth in stablecoin supply), easing macro pressure (the dollar and 10-year yield turning lower, odds of a larger Fed hike fading), and price repair (holding the $62,000 weekend low and reclaiming $75,600, the average cost of recent buyers). Macro is the one setting the pace, and it is where the selloff began. Three forces, each feeding the next, explain most of the decline.
A December hike is largely priced in, the size is not: October CPI rose 0.4% against a 0.3% forecast, and core beat expectations for a second month. A quarter-point hike on December 9 is priced at about 92%, so most of it is absorbed and the open question is the tail: Fed Governor Christopher Waller floated a half-point move, whose odds briefly reached 15%, which would point to a longer, tighter cycle.
The dollar followed yields: As expectations for tighter policy built, the Dollar Index hit 103.4 on Monday, its highest since April 2025, with US yields near 5% and weak growth in Japan and China drawing capital to the dollar. That cuts twice for crypto: Bitcoin is priced in dollars, and higher yields raise the cost of holding an asset that pays none, as gold’s 2% fall on CPI day also showed.
Tech weighed on risk appetite: Then came Nvidia, which announced last week that CEO Jensen Huang resigned after a board investigation; CFO Colette Kress is interim CEO. Nvidia anchors the AI trade, which crypto has increasingly traded alongside, so its sell-off appears to have pulled appetite lower across both. Thin liquidity then amplified the move as clustered long positions were closed when Bitcoin lost $70,000.
Because the forces behind the selloff, a hawkish Fed, a strong dollar and a shaken tech sector, have each reversed in past cycles, stabilization may follow as they ease. In June, Bitcoin fell to $58,500 and rallied nearly 50% by late September, though January shows that earlier episodes did not all resolve that way. The evidence is improving but not conclusive: leverage has been reduced, recent buyers are being cleared out and large holders are adding, yet Bitcoin could still revisit or break the $62,000 low. Late-November PCE inflation and the December 9 Fed meeting will show whether conditions are stabilizing.
TradFi trends
Tokenization is heading to Solana
Last week we covered the launch of Depository Trust & Clearing Corporation’s’s tokenization service on the Canton Network and DTCC’s own private network, with more chains planned for 2027. Solana is now the latest to be named, with DTCC planning to connect its tokenization service there in the second half of 2027, alongside Stellar and Circle’s Arc. DTCC says tokens on the network will carry the same investor protections as traditionally held securities. Solana has been building toward institutional use, with an open-source settlement standard that lets an asset and its payment change hands simultaneously and an upgrade that cuts transaction finality to roughly 150 milliseconds. The plans remain limited to institutions, timelines can change, and they do not indicate how any digital asset will perform.
Macroeconomic roundup
Three signals in 48 hours
Last week’s hot U.S. inflation data lifted rate-hike pricing and the dollar, the same pressures that weighed on crypto. This week tests both channels. Nvidia and Anthropic gauge appetite for AI-linked risk, which crypto has tended to move with, as both sold off in early November. The Fed minutes and a run of international inflation readings show how far rates and the dollar could run, the second pressure on both.
Nvidia earnings (Tuesday): The first report since CEO Jensen Huang’s resignation. Consensus revenue sits just above the company’s own outlook, so meeting guidance may not be enough.
UK CPI (Wednesday): The first reading since the Bank of England raised its benchmark rate to 4%, after September’s 3.5% beat forecasts.
Euro area final CPI (Wednesday): Expected to confirm the 4.0% flash estimate, driven by energy.
Crude oil inventories (Wednesday): Oil has been the swing factor for inflation since the Iran war.
Fed minutes (Wednesday): With a December hike priced in, the question is how far tightening runs afterward.
Anthropic IPO (Wednesday pricing, Thursday trading expected): Up to about $64.4 billion at $70 to $78 a share. Nvidia is among the investors in a related $26 billion placement.
Philadelphia Fed index and jobless claims (Thursday): Early signals on factory prices and labor-market strength.
Japan core CPI (Thursday): Firmer inflation after September’s 2.1% would add to Bank of Japan hike expectations, narrowing the rate gap that has supported the dollar.
The week's most interesting data story
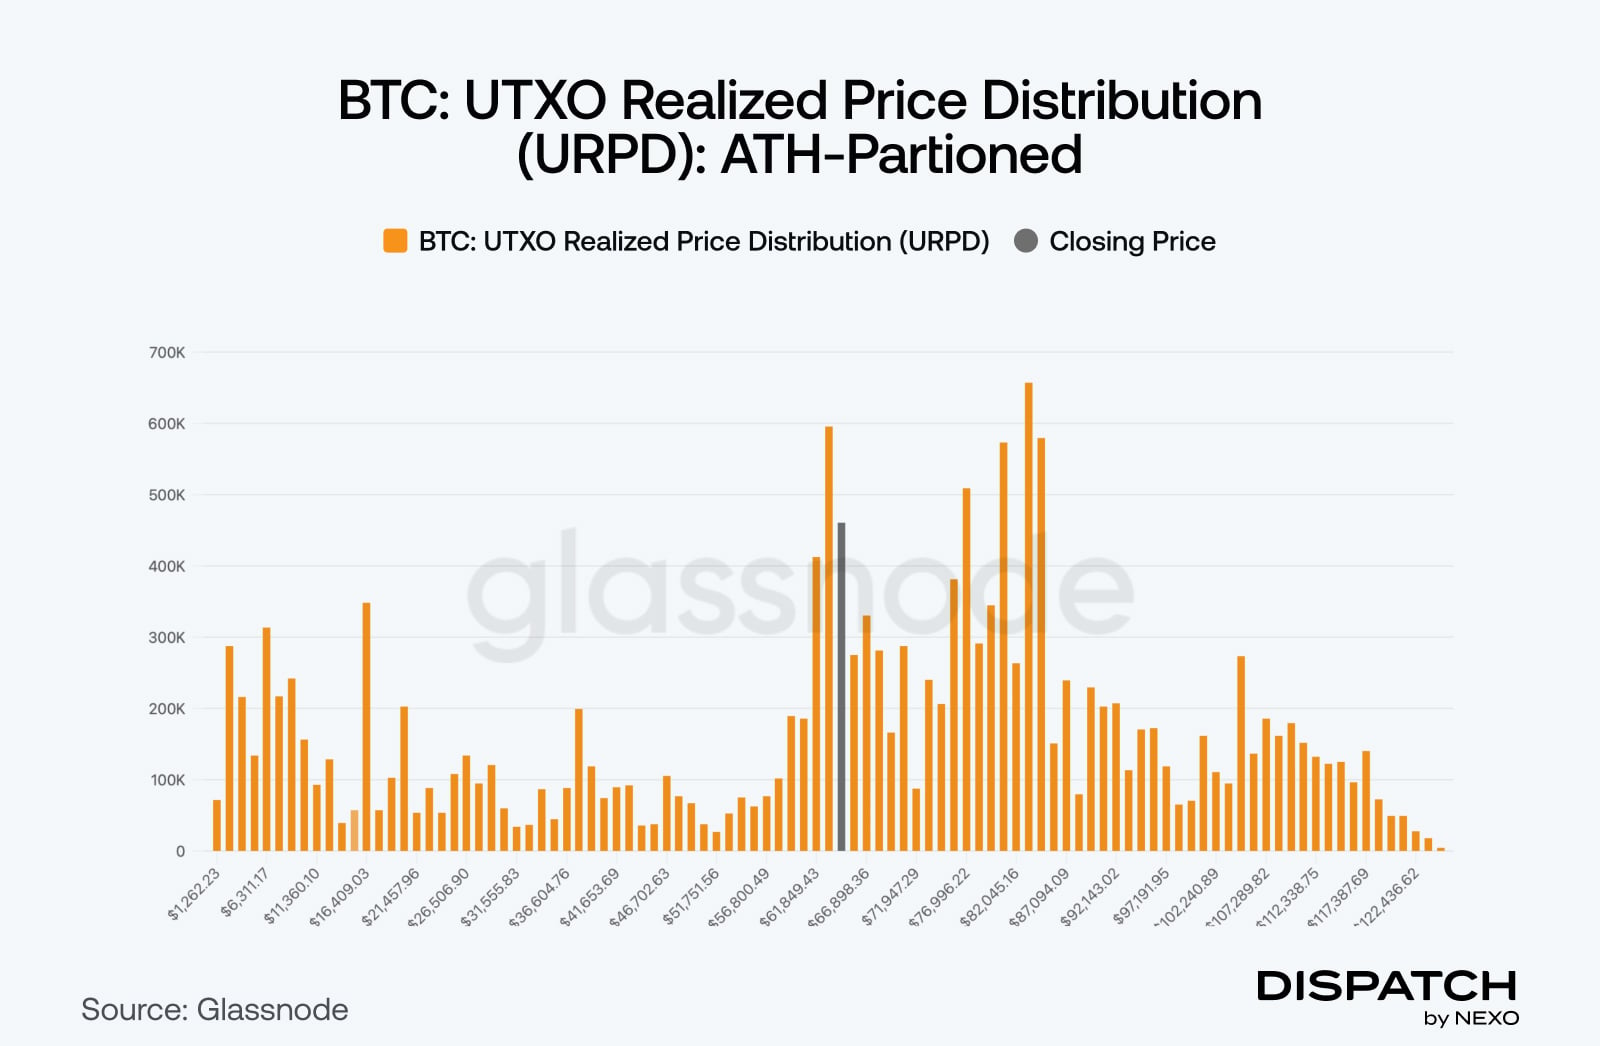
Bitcoin’s current floor and ceiling zones
Bitcoin’s realized price distribution groups coins by the price at which they last moved. About 1.5 million BTC last moved between roughly $62,000 and $65,600, right where the weekend low reversed. Holders there are near break-even and have less reason to sell, which makes it a natural support zone, though the cushion thins below $60,000. The overhead is heavier. About 3.3 million BTC, roughly 16% of supply, last moved between $75,000 and $85,000, as holders who bought near $60,000 appear to have sold into the rally.
The space between the two clusters is the useful part. Supply is lighter between $70,000 and $75,000, so moves through that range can be quick, while the weight above $75,000 suggests a recovery may need to build in steps rather than a straight line. The floor is also being rebuilt. About 400,000 BTC have been re-priced into the $60,000 to $70,000 range since November 12, while overhead supply has shrunk by less than 5%.
The numbers
The week’s most interesting numbers
$1,100 – Bitwise’s 2031 bull-case price for SOL, against $385 in its base case and $80 in its bear case. S
$2.35 billion – Wells Fargo’s reported bitcoin ETF holdings, equal to about 28,070 BTC of exposure, more than double Tesla’s 11,509 BTC.
16 years – How long two Bitcoin addresses sat dormant before moving 100 BTC, worth about $6.9 million at Friday’s price.
$644.1 million – Net inflows into U.S. spot Solana ETFs so far this year, with the funds holding about $1.14 billion in net assets.
$1.2 billion – What the DOJ is seizing or restraining from last month’s Binance incident.
Hot topic
What the community is discussing
Is good ol’ dip buying the right course of action?
Is silver facing the same headwinds as crypto?
“Asset owners are the only winners.”
Dispatch is a weekly publication by Nexo, designed to help you navigate and take action in the evolving world of digital assets. To share your Dispatch suggestions and comments, email us at [email protected].
This content is for informational purposes only and does not constitute investment, legal, or tax advice. Crypto assets are highly volatile and their value can go up or down significantly, including to zero. Past performance and historical correlations are not indicative of future results. Nexo has a commercial interest in the adoption of digital assets.
The availability and use of any products or services made available through Nexo US LC (“Nexo US”) are subject to the applicable terms and conditions on the Nexo US platform. This message is for informational purposes only and does not constitute financial, investment, legal, or tax advice. Any decision you make based on this information is solely your responsibility. Nexo US provides the user interface and routes client instructions to third-party service providers. Investment advisory services for eligible digital asset strategies are provided by Gravitalix Financial, LLC (“Gravitalix”), an investment adviser registered with the U.S. Securities and Exchange Commission. Registration with the SEC does not imply a certain level of skill or training. Please review Gravitalix’s Form ADV and related disclosures carefully before investing. Digital assets are not money or legal tender, are not backed by any government or central bank, and are not insured or guaranteed by any governmental or private insurance scheme (including FDIC or SIPC). Any rates, yields, or rewards displayed in the Nexo US app or related materials are subject to change, may be reduced or discontinued at any time, are not guaranteed, and may not be available in all jurisdictions or for all clients. Past performance is not indicative of future results.
Digital Asset services are provided by Bakkt Financial Solutions I, LLC (NMLS ID 1890144) through a software licensing agreement between Bakkt Financial Solutions I, LLC (“Bakkt”) and Nexo US LLC. Bakkt is not a registered broker-dealer and is not a member of SIPC or FINRA. Digital assets are not FDIC- or SIPC- insured. Bakkt Financial Solutions I, LLC is licensed to engage in virtual currency business activity and money transmission by the New York State Department of Financial Services. Digital asset borrowing requires sufficient collateral. Failure to maintain collateral value due to market volatility may result in the liquidation of your assets. Please ensure that you fully understand the risks involved before trading. See here for Bakkt Licenses and Bakkt Disclosures. If you no longer wish to receive marketing communication from us, including product updates, industry news and exclusive promotions, click here.