What does Q2 hold for crypto?
Apr 15•6 min read

In this patch of your weekly Dispatch:
- ETF inflows turn positive
- Derivatives market rebuilds cleanly
- ETFs change direction
Market cast
Bitcoin sees rising momentum
Q2 is opening with a question mark, but the charts are starting to offer answers. Bitcoin's technical picture is shifting in ways that merit a closer read across both the weekly and daily timeframes.
On the weekly chart, a double bottom formation has emerged, demonstrating a classic reversal pattern that points toward a test of the 20-period SMA. The oscillators support the case: RSI and Stochastic remain in neutral territory but are rising steadily, and the MACD histogram has crossed above the zero line.
The daily picture is more assertive. Price is testing the upper Bollinger Band and approaching the 100-period SMA. The Stochastic is deep in overbought territory with no signs of exhaustion, the RSI is approaching overbought, and the MACD histogram remains firmly positive.
Taken together, both timeframes point toward continuation. Key levels to watch: support at $73,000 and $71,000, resistance at $76,000 and $79,000, where the 100-day SMA converges as a dynamic ceiling that will define the next decisive move.
The big idea
What does Q2 hold for crypto?
For crypto and global markets alike, the start of 2026 was one of the most turbulent quarters in recent memory. A Middle East conflict disrupted the Strait of Hormuz and sent oil prices sharply higher. Renewed tariff escalation rattled trade flows. Fed rate-cut expectations collapsed. As a result, Bitcoin posted its worst Q1 decline since 2018, followed by steeper losses across altcoins. And yet the current drawdown is not only shallower than any previous cycle, it is moving faster too. Selling pressure is being absorbed more quickly than before. The forces behind the selloff are not fully resolved, but beneath the headline decline, the data tells a more nuanced story. This week we look at what comes next.
Watch the flows. Bitcoin ETF inflows turned net positive in March, the first reversal since October 2025. The pattern since the Iran war outbreak is striking: gold ETFs bled nearly $11 billion in outflows while Bitcoin ETFs continued to attract capital. JPMorgan flagged the divergence explicitly, noting that Bitcoin drew inflows as gold sold off — a reversal of the historical safe-haven playbook. April has continued the trend, with the trailing seven-day inflow running above $500 million.
The institutional bid is deepening, not retreating. Morgan Stanley became the first Wall Street bank to launch its own Bitcoin ETF last week, debuting MSBT on NYSE Arca with the lowest fee in the market. The bank also filed for Ethereum and Solana trusts in January. This is a $7 trillion wealth management platform making a structural commitment. However the market is two-sided. While institutional participation is accelerating, retail inflows are retreating with CryptoQuant data showing small-account inflows on Binance at a nine-year low.
The macro variable remains open. Fed Chair nominee Kevin Warsh’s confirmation hearing is the quarter's most watched macro event as Jerome Powell's term expires on May 15. Markets have sharply repriced rate cut expectations and the first cut is now seen no earlier than September. Warsh's stance is two-sided. He has criticized the Fed's hesitancy to cut as "a mark against the institution," but has signaled that balance sheet reduction comes before cuts. A hawkish performance would push cut expectations into 2027, while a flexible signal could potentially bring them back to Q3.
Regulatory clarity is coming. The GENIUS Act is gradually being implemented, with the OCC and FDIC having proposed frameworks and all regulators facing a July 18 deadline for final rules. The CLARITY Act stalled in Q1 over the stablecoin yield dispute, but a second round of compromise language is under review and a Senate Banking Committee markup is targeted for late April. May could be the pivotal month for legislative progress.
Capital is parked, not gone. The top-five stablecoin supply is holding near all-time highs at $267.9 billion. RWA tokenisation grew 29.8% in Q1 despite the market decline. The capital sitting in stablecoins, tokenised Treasuries, and vaults has not left the ecosystem, it is waiting.
Three catalysts could move it in Q2: geopolitical de-escalation, a Fed pivot signal, and CLARITY Act progress. Any one of them would shift sentiment, while all three together would unlock the next leg-up.
Blue chips
Ethereum and the infrastructure trade
Ethereum network fundamentals appear stronger than ever despite price being down 55% from its August 2025 peak. Ethereum stablecoin supply hit $180 billion in Q1, which represents 60% of total supply across all networks. JPMorgan, BlackRock, and Amundi have all launched tokenized funds on Ethereum. Jamie Dimon's shareholder letter last week acknowledged that blockchain competition is accelerating and his bank is not moving fast enough. Citi framed it plainly: the divergence between on-chain fundamentals and price is the central tension and the central opportunity of 2026. Whether that gap closes through price catching up to fundamentals, or fundamentals deteriorating toward price, is the ETH question for Q2.
TradFi trends
Stablecoins move toward the mainstream
Chainalysis projects that adjusted stablecoin volumes will reach $719 trillion by 2035, with real-world payment volumes matching Visa and Mastercard by 2039. Stablecoins already moved $35 trillion on blockchain rails last year but only around 1% was real-world payments like commerce, remittances, and business transfers. The rest was crypto-native activity. The growth catalyst is structural: an estimated $100 trillion wealth transfer from Baby Boomers to Millennials and Gen Z will put a crypto-native generation in control of capital at scale.
The week's most interesting data story
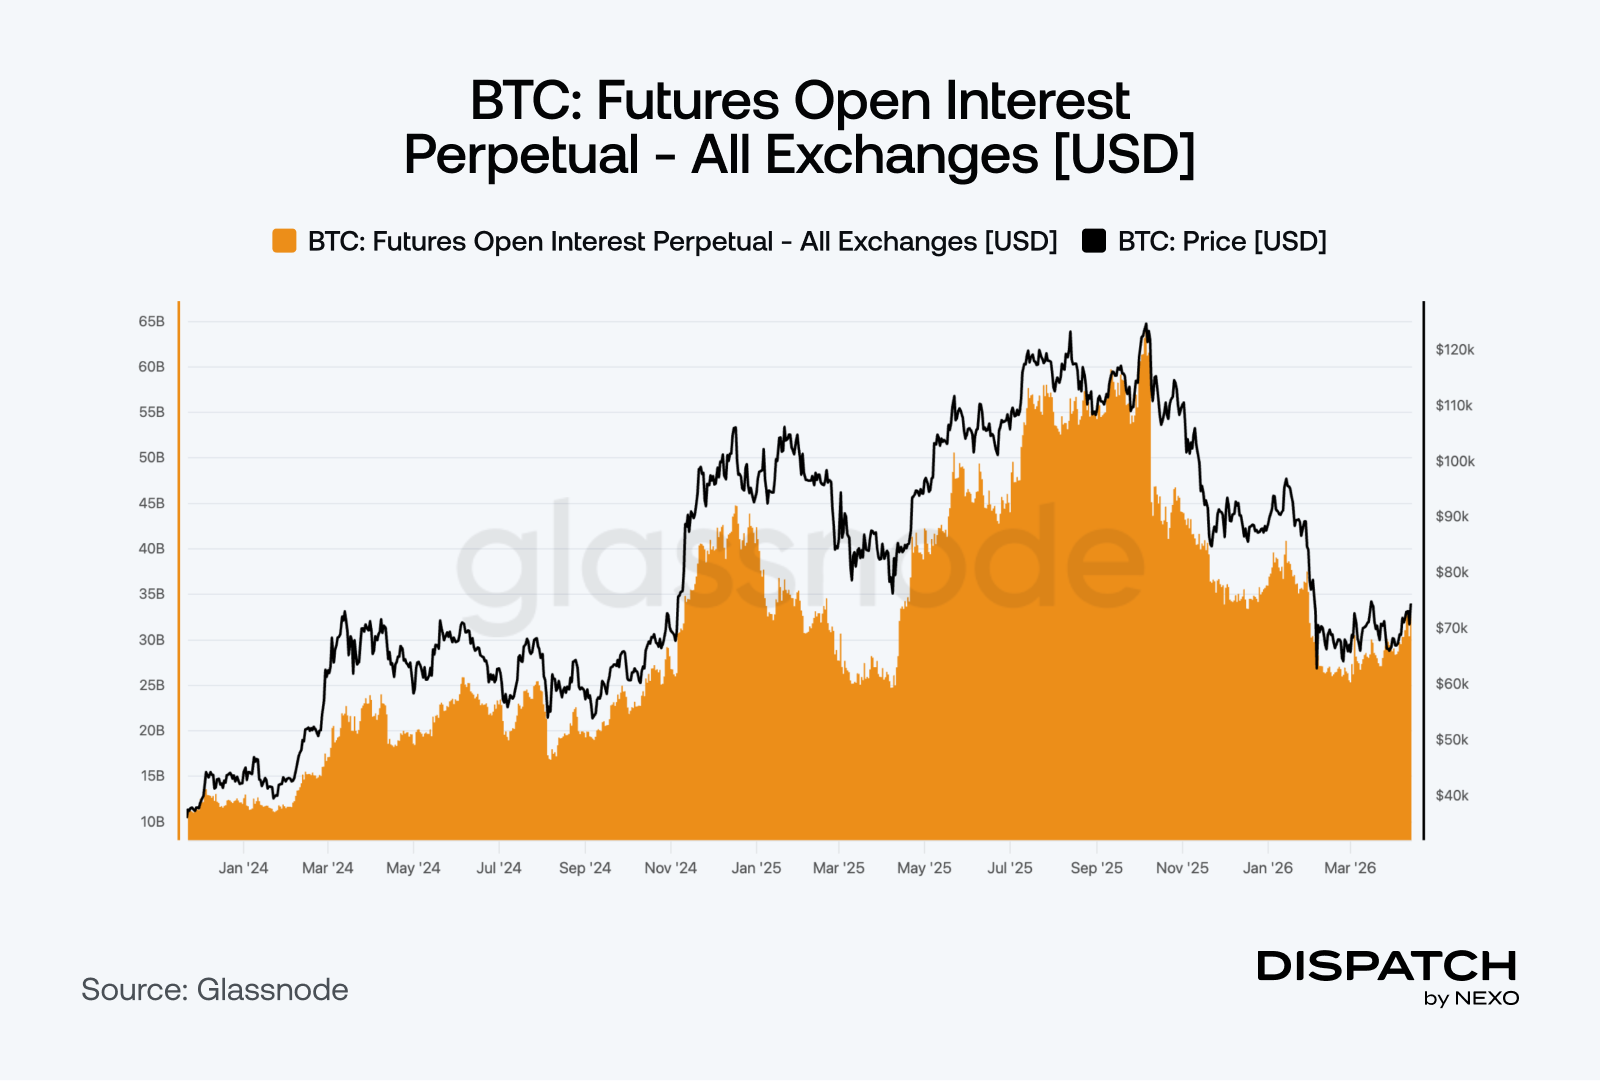
The market is rebuilding from a clean base
Open interest in BTC perpetual futures has recovered 31% from its low point in March to $33.2 billion. The quality of that recovery matters as much as the size. Annualised funding rates started 2026 at 0.08%, a modest long bias, then it turned negative on 32 days between February and March as bearish sentiment took hold. They have now compressed to near zero.
The 3-month rolling basis has fallen from nearly 5% in January to 1.6% today. At 5%, much of the market was driven by carry traders buying spot and shorting futures to pocket the difference, with no view on price. When the premium collapsed, they exited mechanically and amplified the selloff. At 1.6%, that trade is gone. What remains is directional positioning without a leverage overlay — the cleanest derivatives structure since before the October peak. When the next catalyst arrives, it will not be absorbed by a market full of leveraged longs waiting to be liquidated.
The numbers
The week’s most interesting numbers
+7.4% — Bitcoin's return since the Iran war outbreak on February 27. Gold is down 9.8% over the same period.
780,897 BTC — Strategy's total holdings after adding 13,927 BTC last week. More than 3.7% of the total 21 million supply.
4.87 million ETH — Bitmine's ETH holdings, equal to 4% of circulating supply. 68% is staked, generating $212 million in annualized staking revenue.
$29.1 billion — Tokenized real-world assets on-chain as of April 12, an all-time high. Up 1,576% since January 2024. 46% sits in U.S. Treasuries, 18% in commodities. Institutions are tokenizing safe yield.
Hot topic
What the community is discussing
Selling pressure from large holders declines and on-chain Bitcoin supply tightens.
Resilient institutional demand as Bitcoin ETFs achieve positive year-to-date flows despite recent price weakness.
Bitcoin is regaining safe-haven status while money rotates out of gold, according to major asset manager analysis.
Dispatch is a weekly publication by Nexo, designed to help you navigate and take action in the evolving world of digital assets. To share your Dispatch suggestions and comments, email us at [email protected].