Bull flags vs bear flags: como traders de cripto leem as tendências
Dec 08, 2025•8 min read
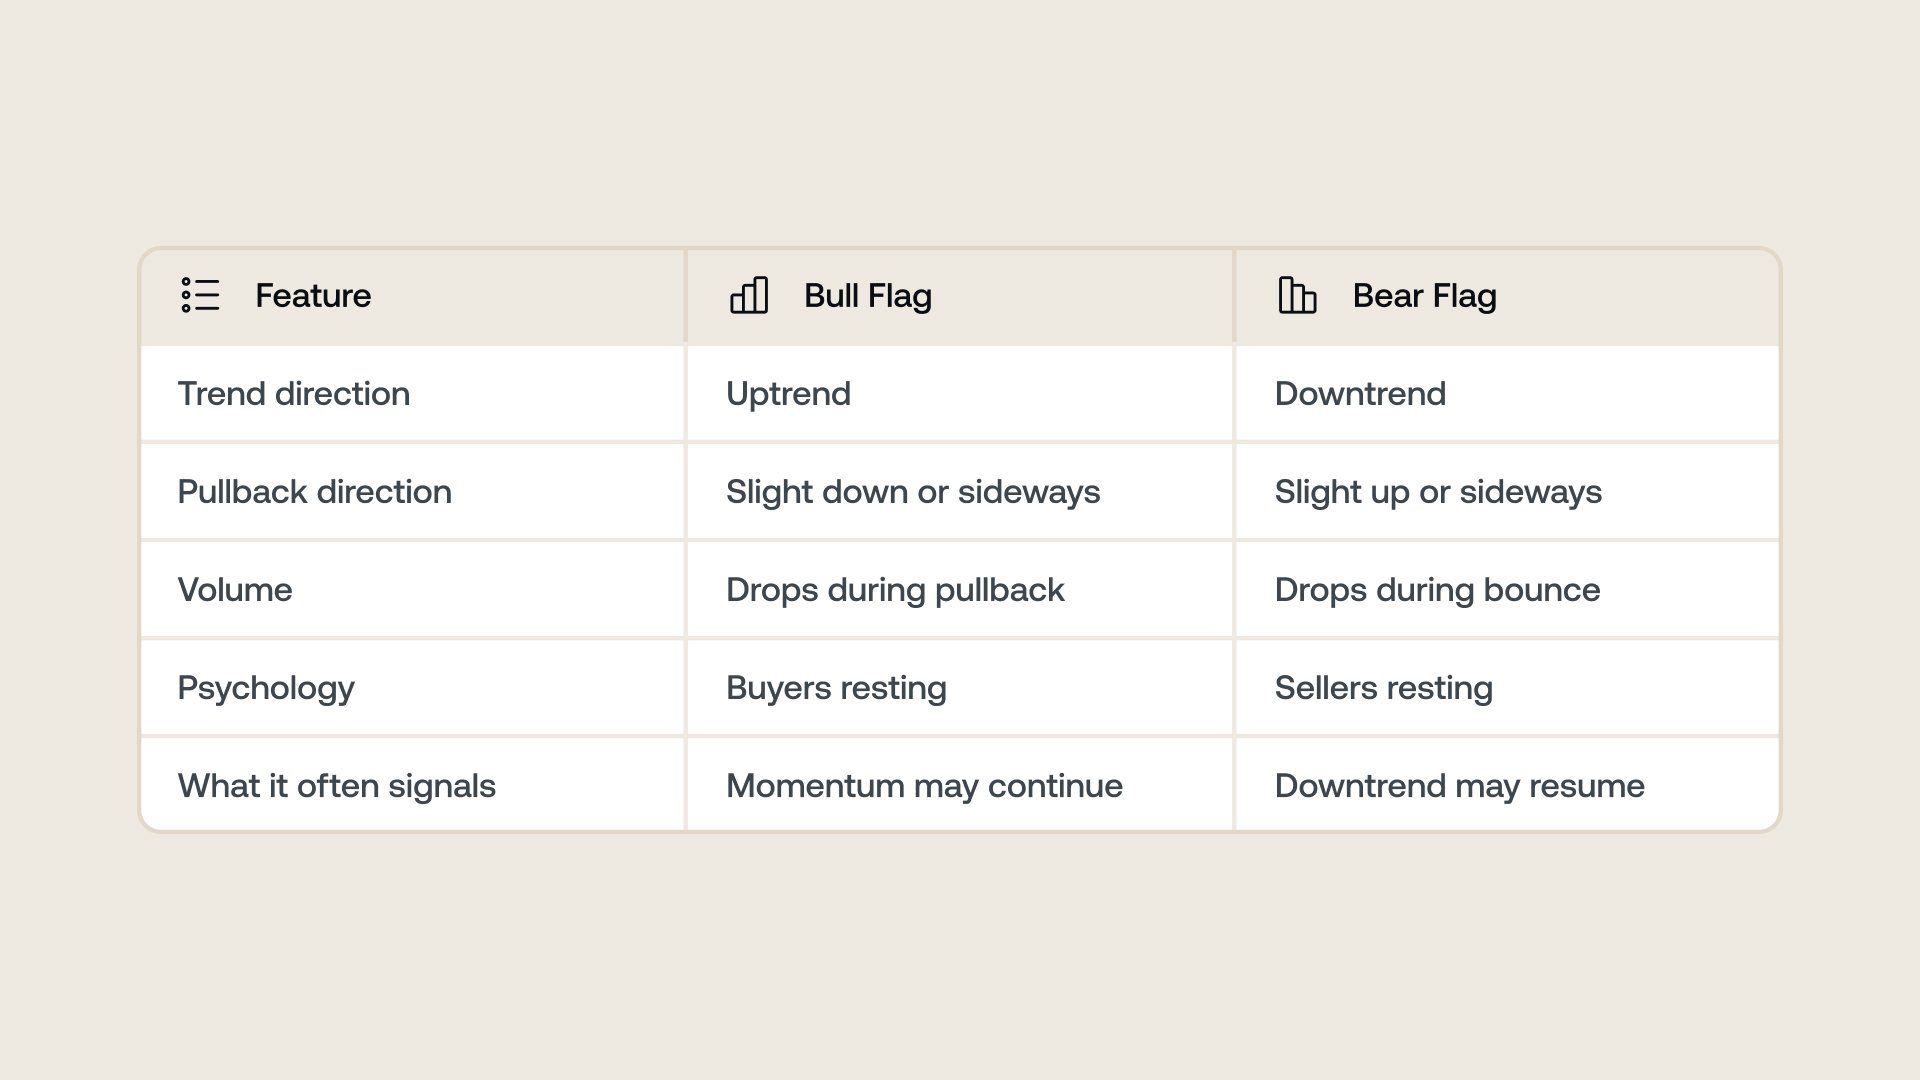
Bull flags e bear flags são padrões de gráfico que os traders procuram ao tentar entender se uma tendência pode continuar. Uma bull flag aparece durante um movimento de alta, enquanto uma bear flag aparece durante um movimento de baixa.
Elas não preveem o futuro — oferecem estrutura em um momento em que as pessoas não têm certeza se o mercado está ficando bullish, esfriando ou ainda preso em uma Tendência de baixa mais ampla.
Por que esses padrões importam?
Se você passa algum tempo nas redes sociais, já conhece o debate:
Estamos em um bull market? Ele já chegou ao topo? Estamos entrando em uma fase de bear market mais lenta?
A verdade é que cripto raramente dá respostas claras em tempo real. Mas esses padrões ajudam você a entender o que o mercado está fazendo hoje — não o que ele “deveria” fazer.
As flags oferecem:
- Uma forma de ler a força da tendência.
- Uma estrutura simples para entender correções.
- Uma perspectiva mais calma quando o preço anda de lado.
Isso as torna úteis tanto para quem é novo em negociação quanto para quem já se sente à vontade lendo gráficos.
O que é uma bull flag?
Uma bull flag aparece quando o Mercado sobe rápido e depois faz uma pausa sem reverter.
Pense nela como uma corrida rápida ladeira acima seguida de um descanso curto — mas a direção não mudou.
O mastro (o movimento rápido).
É um salto forte no preço.
- Geralmente é acentuado e cheio de energia.
- Muitas vezes é acompanhado por alto Volume de negociação.
- Mostra forte interesse dos compradores.
A bandeira (o descanso).
É a pequena correção que vem em seguida.
- Anda de lado ou ligeiramente para baixo.
- O Volume diminui.
- Muitas vezes dura alguns dias ou semanas, dependendo do período analisado.
Após um grande movimento, os traders realizam lucros, as Posições long são zeradas e o Mercado “esfria” sem quebrar a estrutura. Quando o preço rompe acima do topo da bandeira, os traders veem isso como um sinal de que os compradores podem estar prontos para voltar a pressionar.
Você vai ouvir muitos traders dizendo: “a correção segurou no nível de Fibonacci de 38,2%”. Veja o que isso significa:
Os níveis de Fibonacci são pontos comuns de retração — porcentagens que os traders usam para estimar até onde uma correção considerada normal pode chegar. 38,2% simplesmente significa que o preço recuou menos da metade do movimento original — um sinal de que a Tendência de alta ainda pode estar forte.
É apenas uma ferramenta para medir “quão fundo foi o recuo?”.
O que é uma bear flag?
Uma bear flag é o mesmo padrão, só que invertido. Em vez de uma alta forte seguida de uma correção suave, é uma queda intensa seguida de um repique fraco.
O mastro (a venda rápida).
- Movimento acentuado de queda.
- Volume alto.
- Impulsionado por medo, liquidações ou sentimento negativo.
A bandeira (o repique fraco).
Essa parte pega muitos iniciantes de surpresa — parece uma recuperação, mas não é.
- O preço sobe devagar.
- O Volume é baixo.
- Os compradores não parecem comprometidos.
Por que isso importa?
Bear flags costumam aparecer em momentos de incerteza. Elas podem surgir mesmo quando o sentimento nas redes está bullish. Em Tendências de baixa, esses “pequenos repiques” geralmente são pausas antes de os vendedores voltarem. Um rompimento abaixo da parte de baixo da bandeira sinaliza continuação da tendência.
Por que esses padrões são úteis no Mercado atual?
Hoje, o mercado cripto está em uma situação conhecida: movimentos fortes seguidos de dúvida. Alguns Ativos rompem para cima. Outros ficam para trás. O sentimento muda rápido.
As flags se destacam nesses momentos porque cortam o ruído:
- Em vez de perguntar “estamos em um bull market?”, você pergunta:
“essa tendência ainda está saudável?” - Em vez de perguntar “estamos em um bear market?”, você pergunta:
“os vendedores ainda estão no controle?”
Isso transforma a incerteza em algo mais claro e tranquilo.
Entender bull e bear flags dá uma visão mais clara do Mercado, especialmente quando o sentimento muda rápido.
Muitos investidores preferem manter Posições nessas fases, mas com uma abordagem flexível — por exemplo, Ganhar juros sobre Ativos em períodos mais calmos ou acessar liquidez sem vender quando surgem oportunidades.
Guia para iniciantes sobre como interpretar flags
Se você está começando a usar gráficos:
- Pense nas bull flags como quedas controladas em Tendências de alta fortes.
- Pense nas bear flags como recuperações fracas em Tendências de baixa.
- Você não precisa desenhar linhas perfeitas para enxergar o formato geral.
- Você não precisa memorizar todos os indicadores — a estrutura de preço conta a história.
As flags ajudam você a enxergar o Mercado com menos estresse.
Como validar uma flag?
1. Olhe para a tendência maior
Flags são padrões de continuação — funcionam melhor quando o tempo gráfico mais alto as confirma.
2. Confira o Volume.
O Volume mostra quantas pessoas estão realmente negociando durante um movimento.
- Em uma bull flag saudável, a correção geralmente acontece com Volume mais baixo. Isso significa que há menos vendedores ativos e que o Mercado está principalmente em pausa, não revertendo.
- Se, durante a correção, o Volume aumenta de repente, isso pode indicar que os vendedores estão ficando mais agressivos. Esse é um sinal para ter cuidado, pois uma pressão vendedora mais forte pode quebrar o padrão.
Pense em uma correção como o Mercado fazendo uma pausa rápida antes de possivelmente continuar na mesma direção. Correções acontecem porque traders realizam lucros ou porque o Mercado simplesmente precisa esfriar após um movimento rápido.
3. Fique de olho nos fakeouts
Um fakeout é quando o preço se move brevemente para fora do padrão da flag — acima ou abaixo — e depois volta rapidamente para dentro. Isso muitas vezes leva traders a acreditar que um rompimento ou um desabamento começou.
Cripto faz isso com frequência porque é um Mercado muito líquido e rápido.
4. Entenda a invalidação
Invalidação é o ponto em que um padrão deixa de fazer sentido.
No caso das flags, o padrão é invalidado quando o preço rompe na direção oposta e permanece fora da estrutura.
Isso mostra aos traders que “o setup não se sustentou”, permitindo reavaliar com calma em vez de reagir com emoção.
5. Mantenha o risco baixo em períodos de incerteza
As flags ajudam você a entender como uma tendência está se comportando, mas não garantem o que vai acontecer depois.
Os mercados muitas vezes parecem bem definidos — até que deixam de ser —, especialmente nas transições entre fases bullish e bearish. Por isso traders mantêm o tamanho das Posições menor quando o Mercado parece pouco claro.
O que traders experientes observam?
Para leitores com mais experiência:
- Open interest: o open interest em alta durante a consolidação pode alimentar a continuação da tendência.
- Funding rates: uma funding rate extrema pode transformar uma boa flag em armadilha.
- Bolsões de liquidez: as flags tendem a romper em direção às áreas com stops concentrados.
- Amplitude do Mercado: flags fortes aparecem quando vários Ativos se movem em sincronia.
Perguntas frequentes.
1. O que é uma bull flag em cripto?
Uma bull flag é um padrão que se forma em uma Tendência de alta: uma alta forte seguida de uma correção pequena e controlada. Traders a observam para ver se os compradores ainda têm impulso. Quando a correção é rasa e o Volume cai, isso geralmente indica que a Tendência de alta pode continuar, mas nunca há garantia.
2. O que é uma bear flag e como ela é diferente de uma recuperação real?
Uma bear flag começa com uma queda forte, seguida de um repique fraco e com pouco Volume. Ela parece uma recuperação, mas os compradores não mostram força. Se o Mercado rompe para baixo a partir dessa estrutura, isso sugere que os vendedores ainda podem estar no controle.
3. Como saber se uma correção é uma bull flag ou o início de uma reversão?
Correções em bull flags são rasas, com pouco Volume e acontecem em um canal estreito. Uma reversão geralmente tem vendas mais fortes, Volume crescente ou rompimentos abaixo de suportes importantes. Olhar o tempo gráfico maior ajuda a esclarecer a diferença.
4. Por que bull e bear flags às vezes falham?
As flags falham quando condições mais amplas anulam o padrão. Isso pode incluir mudanças de sentimento, notícias repentinas ou desequilíbrios de Alavancagem. Uma bull flag falhar significa que os compradores perderam força. Uma bear flag falhar significa que os vendedores recuaram.
5. Como traders usam o Volume para confirmar uma flag?
Durante uma bull flag, o Volume normalmente cai enquanto a correção se forma e volta a subir no rompimento. Em uma bear flag, o Volume diminui no repique fraco e aumenta se o preço voltar a cair. Isso ajuda a mostrar se o momentum está alinhado com a tendência.
6. Como o Fibonacci ajuda na leitura das flags?
Os níveis de Fibonacci ajudam a medir a profundidade de uma correção. Permanecer acima da retração de 38,2% costuma reforçar uma bull flag. Repique fraco que não alcança os níveis de 38,2%–50% costuma estar alinhado com bear flags. É apenas uma ferramenta para avaliar a força da tendência.
7. As flags são úteis no Mercado cripto incerto de hoje?
Sim. Independentemente de o ciclo mais amplo estar bullish ou bearish, as flags ajudam a ler a força de curto prazo. Bull flags recorrentes geralmente sinalizam compradores ativos. Bear flags indicam que os vendedores ainda dominam. Elas simplificam a leitura da tendência sem prever resultados.
8. Padrões de flags ajudam iniciantes e traders intermediários?
Iniciantes usam flags para reconhecer correções e evitar pânico durante as quedas. Traders intermediários as combinam com dados de Volume, funding e liquidez. Ambos se beneficiam porque as flags oferecem estrutura quando os Mercados parecem confusos.
9. As flags aparecem tanto em bull quanto em bear markets?
Sim. A principal diferença é a direção: bull flags aparecem em períodos de movimento para cima, enquanto bear flags aparecem em períodos de movimento para baixo. Durante transições — como em partes do Mercado atual —, ambas podem surgir enquanto a direção da tendência é testada.
O conteúdo deste artigo tem finalidade apenas informativa e educacional em termos gerais. Ele não constitui, nem deve ser usado, como aconselhamento financeiro, de investimentos, Jurídico, contábil ou tributário, nem como recomendação para comprar, vender ou manter qualquer criptomoeda ou outro instrumento financeiro. Negociar e investir em ativos digitais como Bitcoin e outras criptomoedas é, por natureza, especulativo e envolve risco significativo de perda. Sempre faça sua própria pesquisa e consulte um profissional qualificado antes de tomar qualquer decisão financeira.