Digital Assets in Q4: Market Outlook
Oct 21•10 min read
Contents:
- Q4 Outlook
- Key Events to Watch in Q4
- Q3 2026 Overview
- Risk Disclosure
Overview:
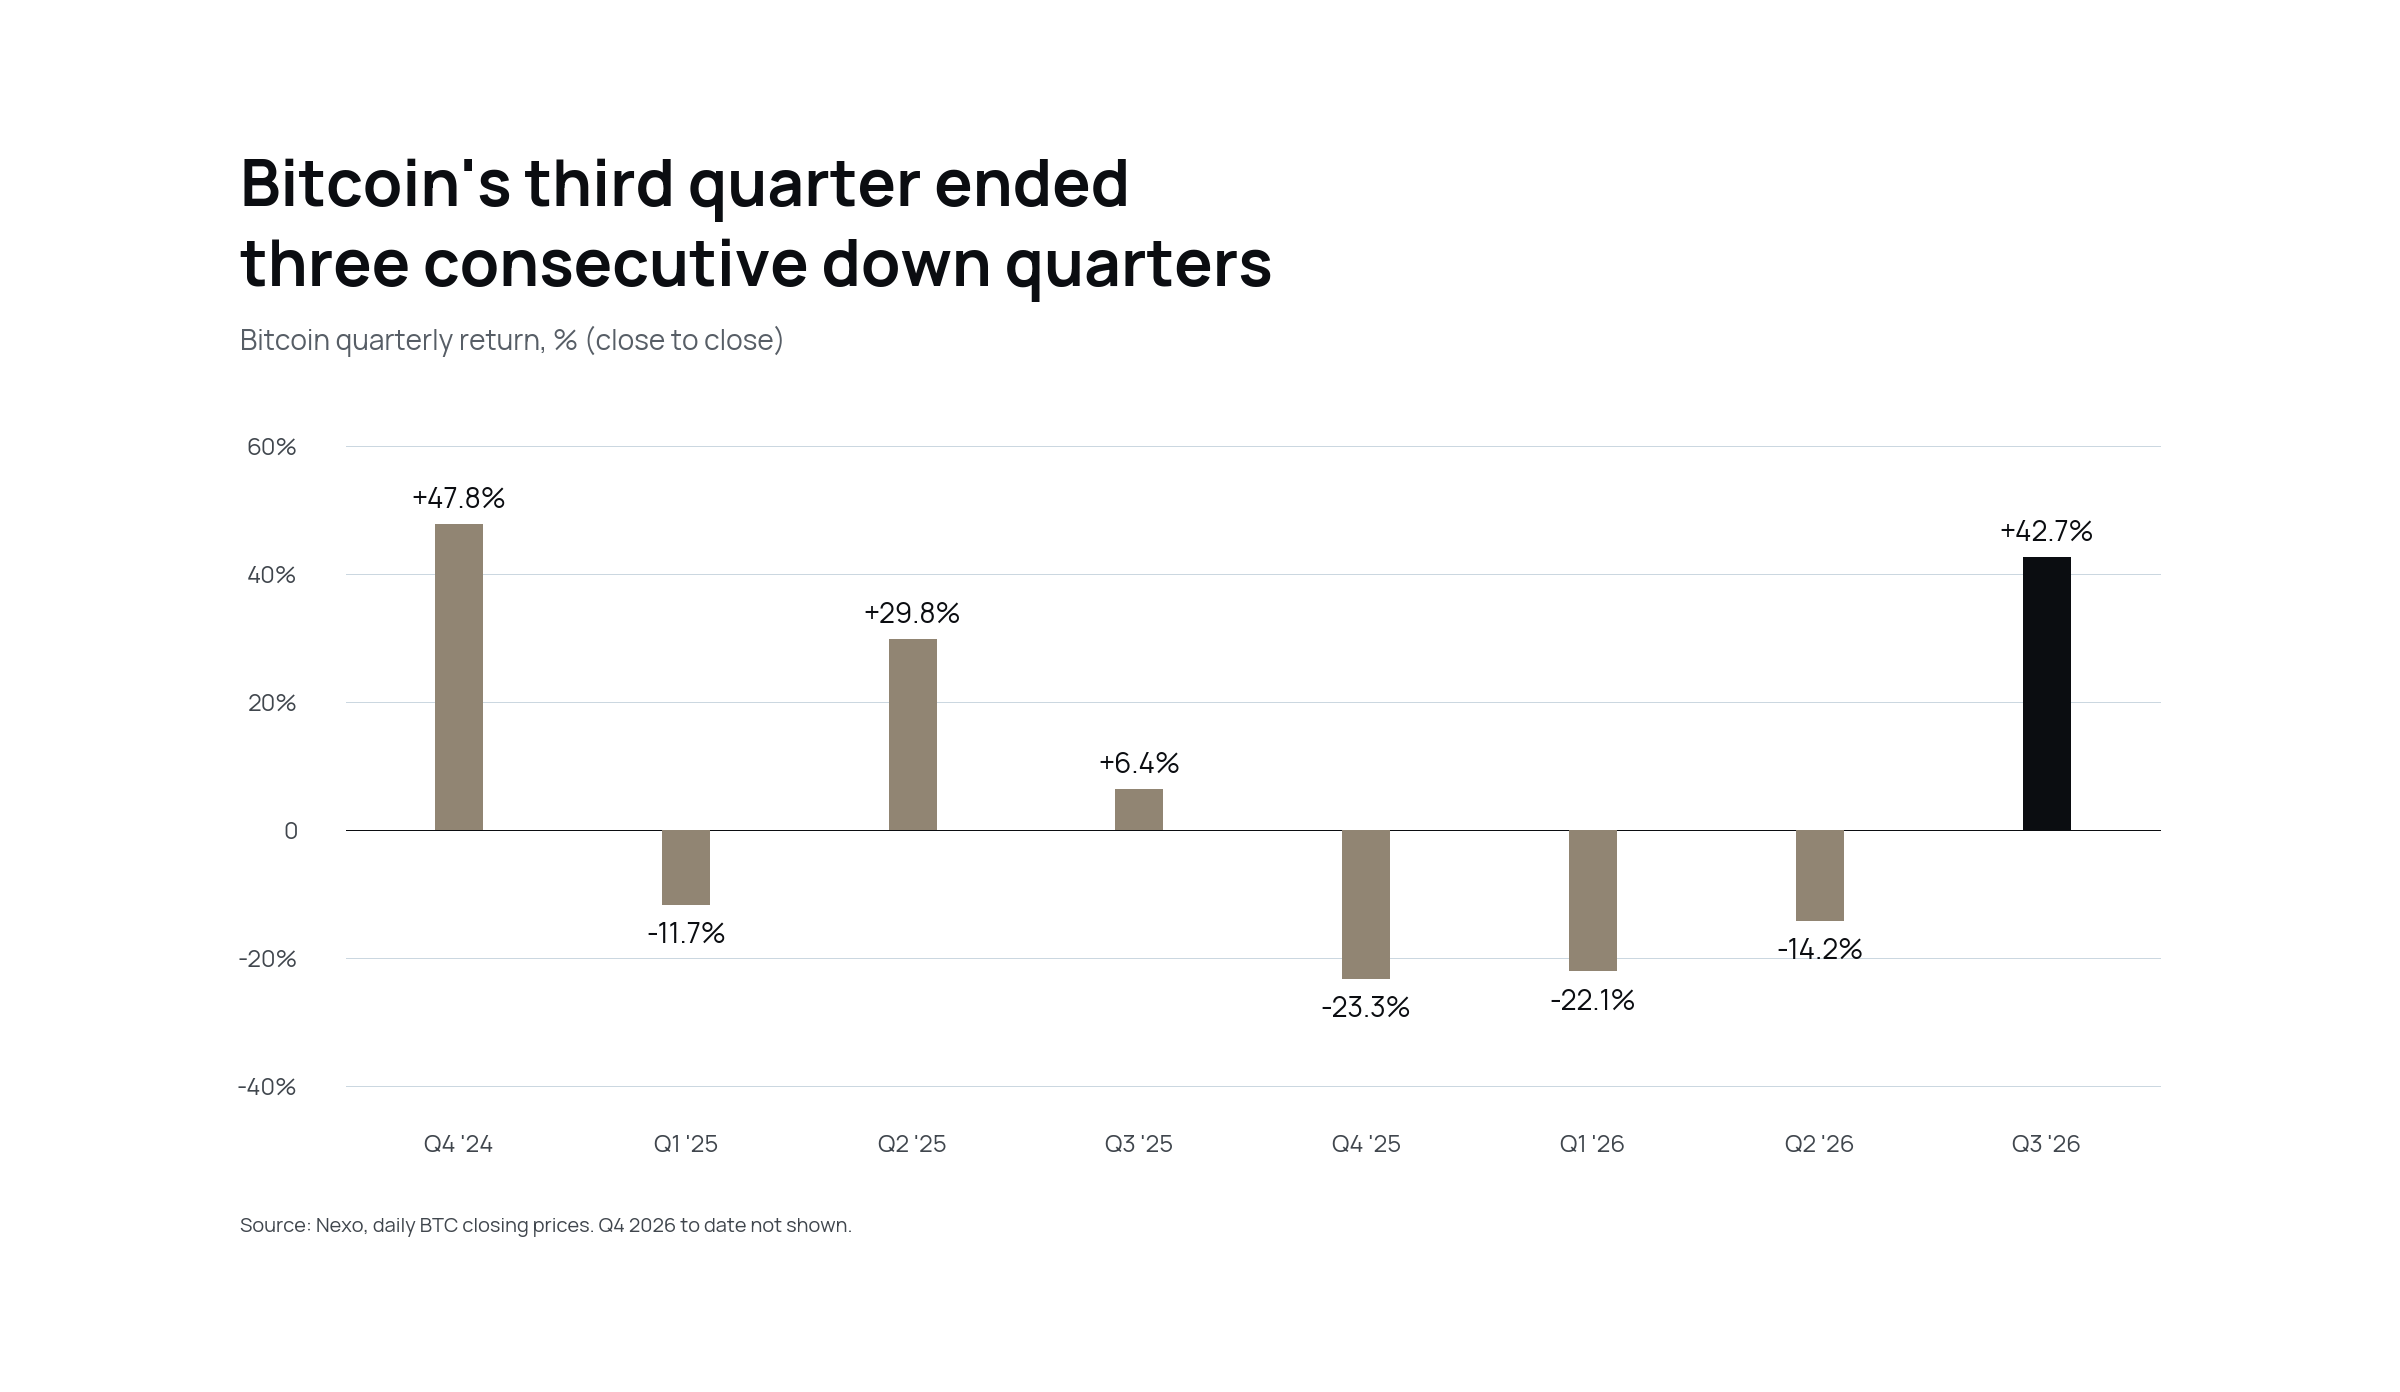
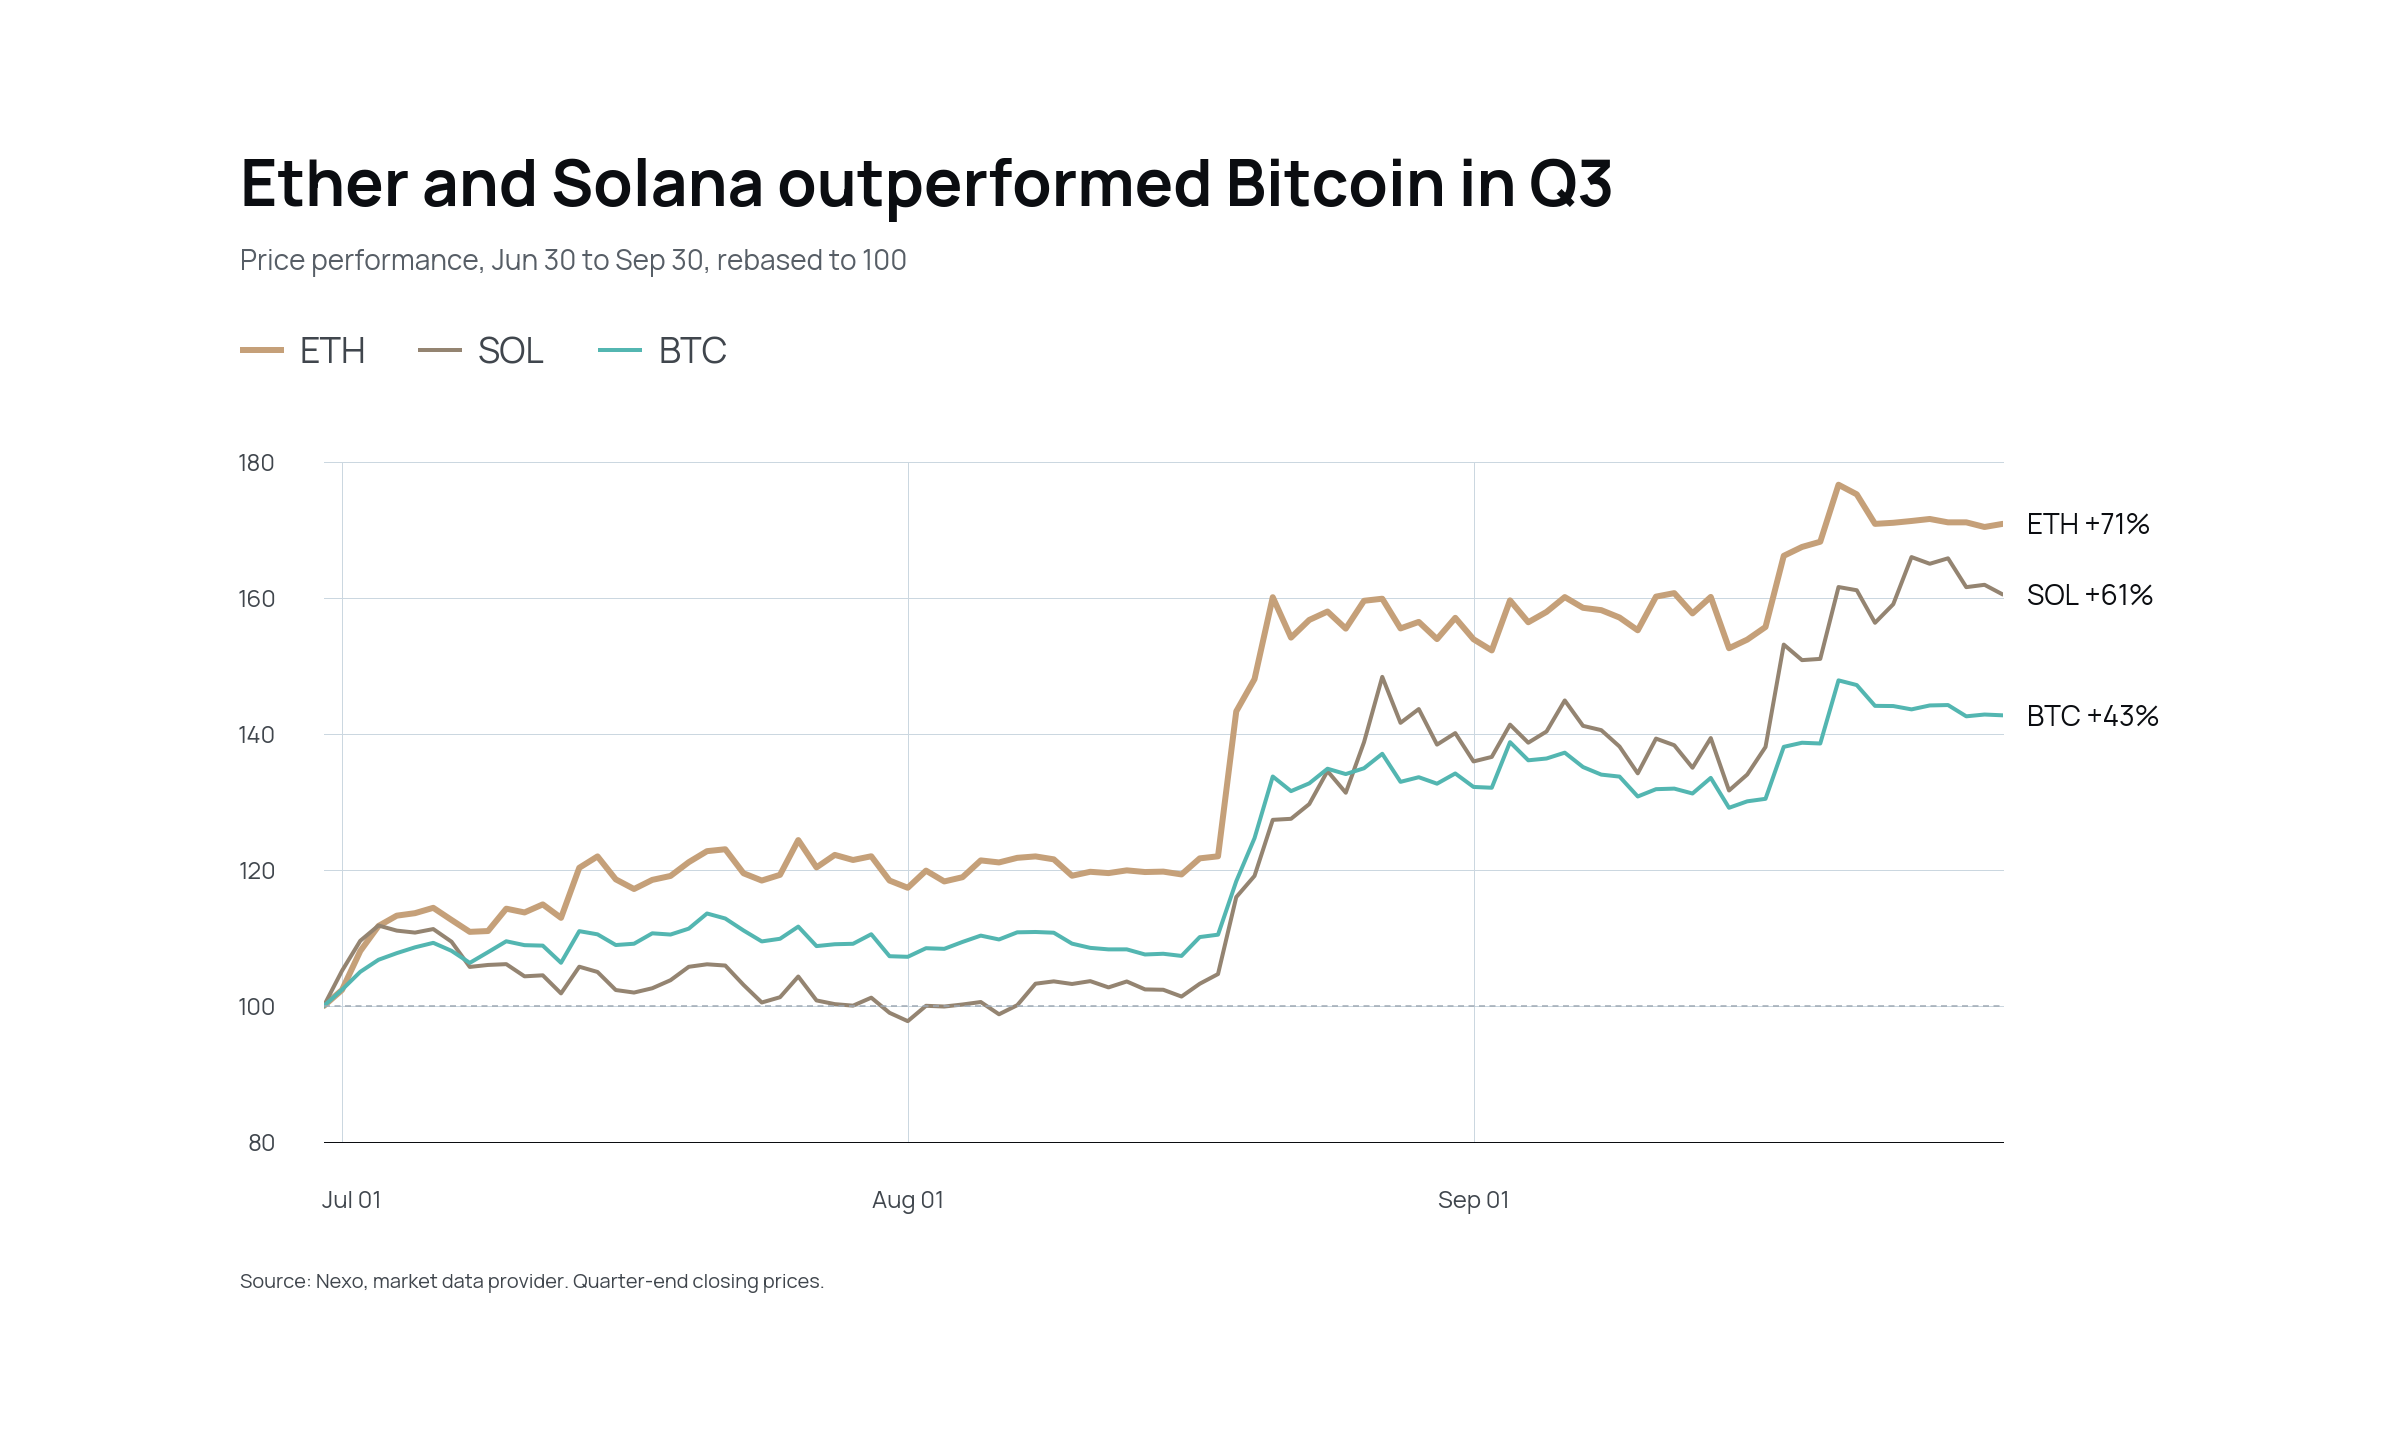
- Bitcoin ended Q3 up 42.7%, from $58,544 to $83,570, ending three consecutive down quarters. Ether rose 70.9% and Solana about 60%.
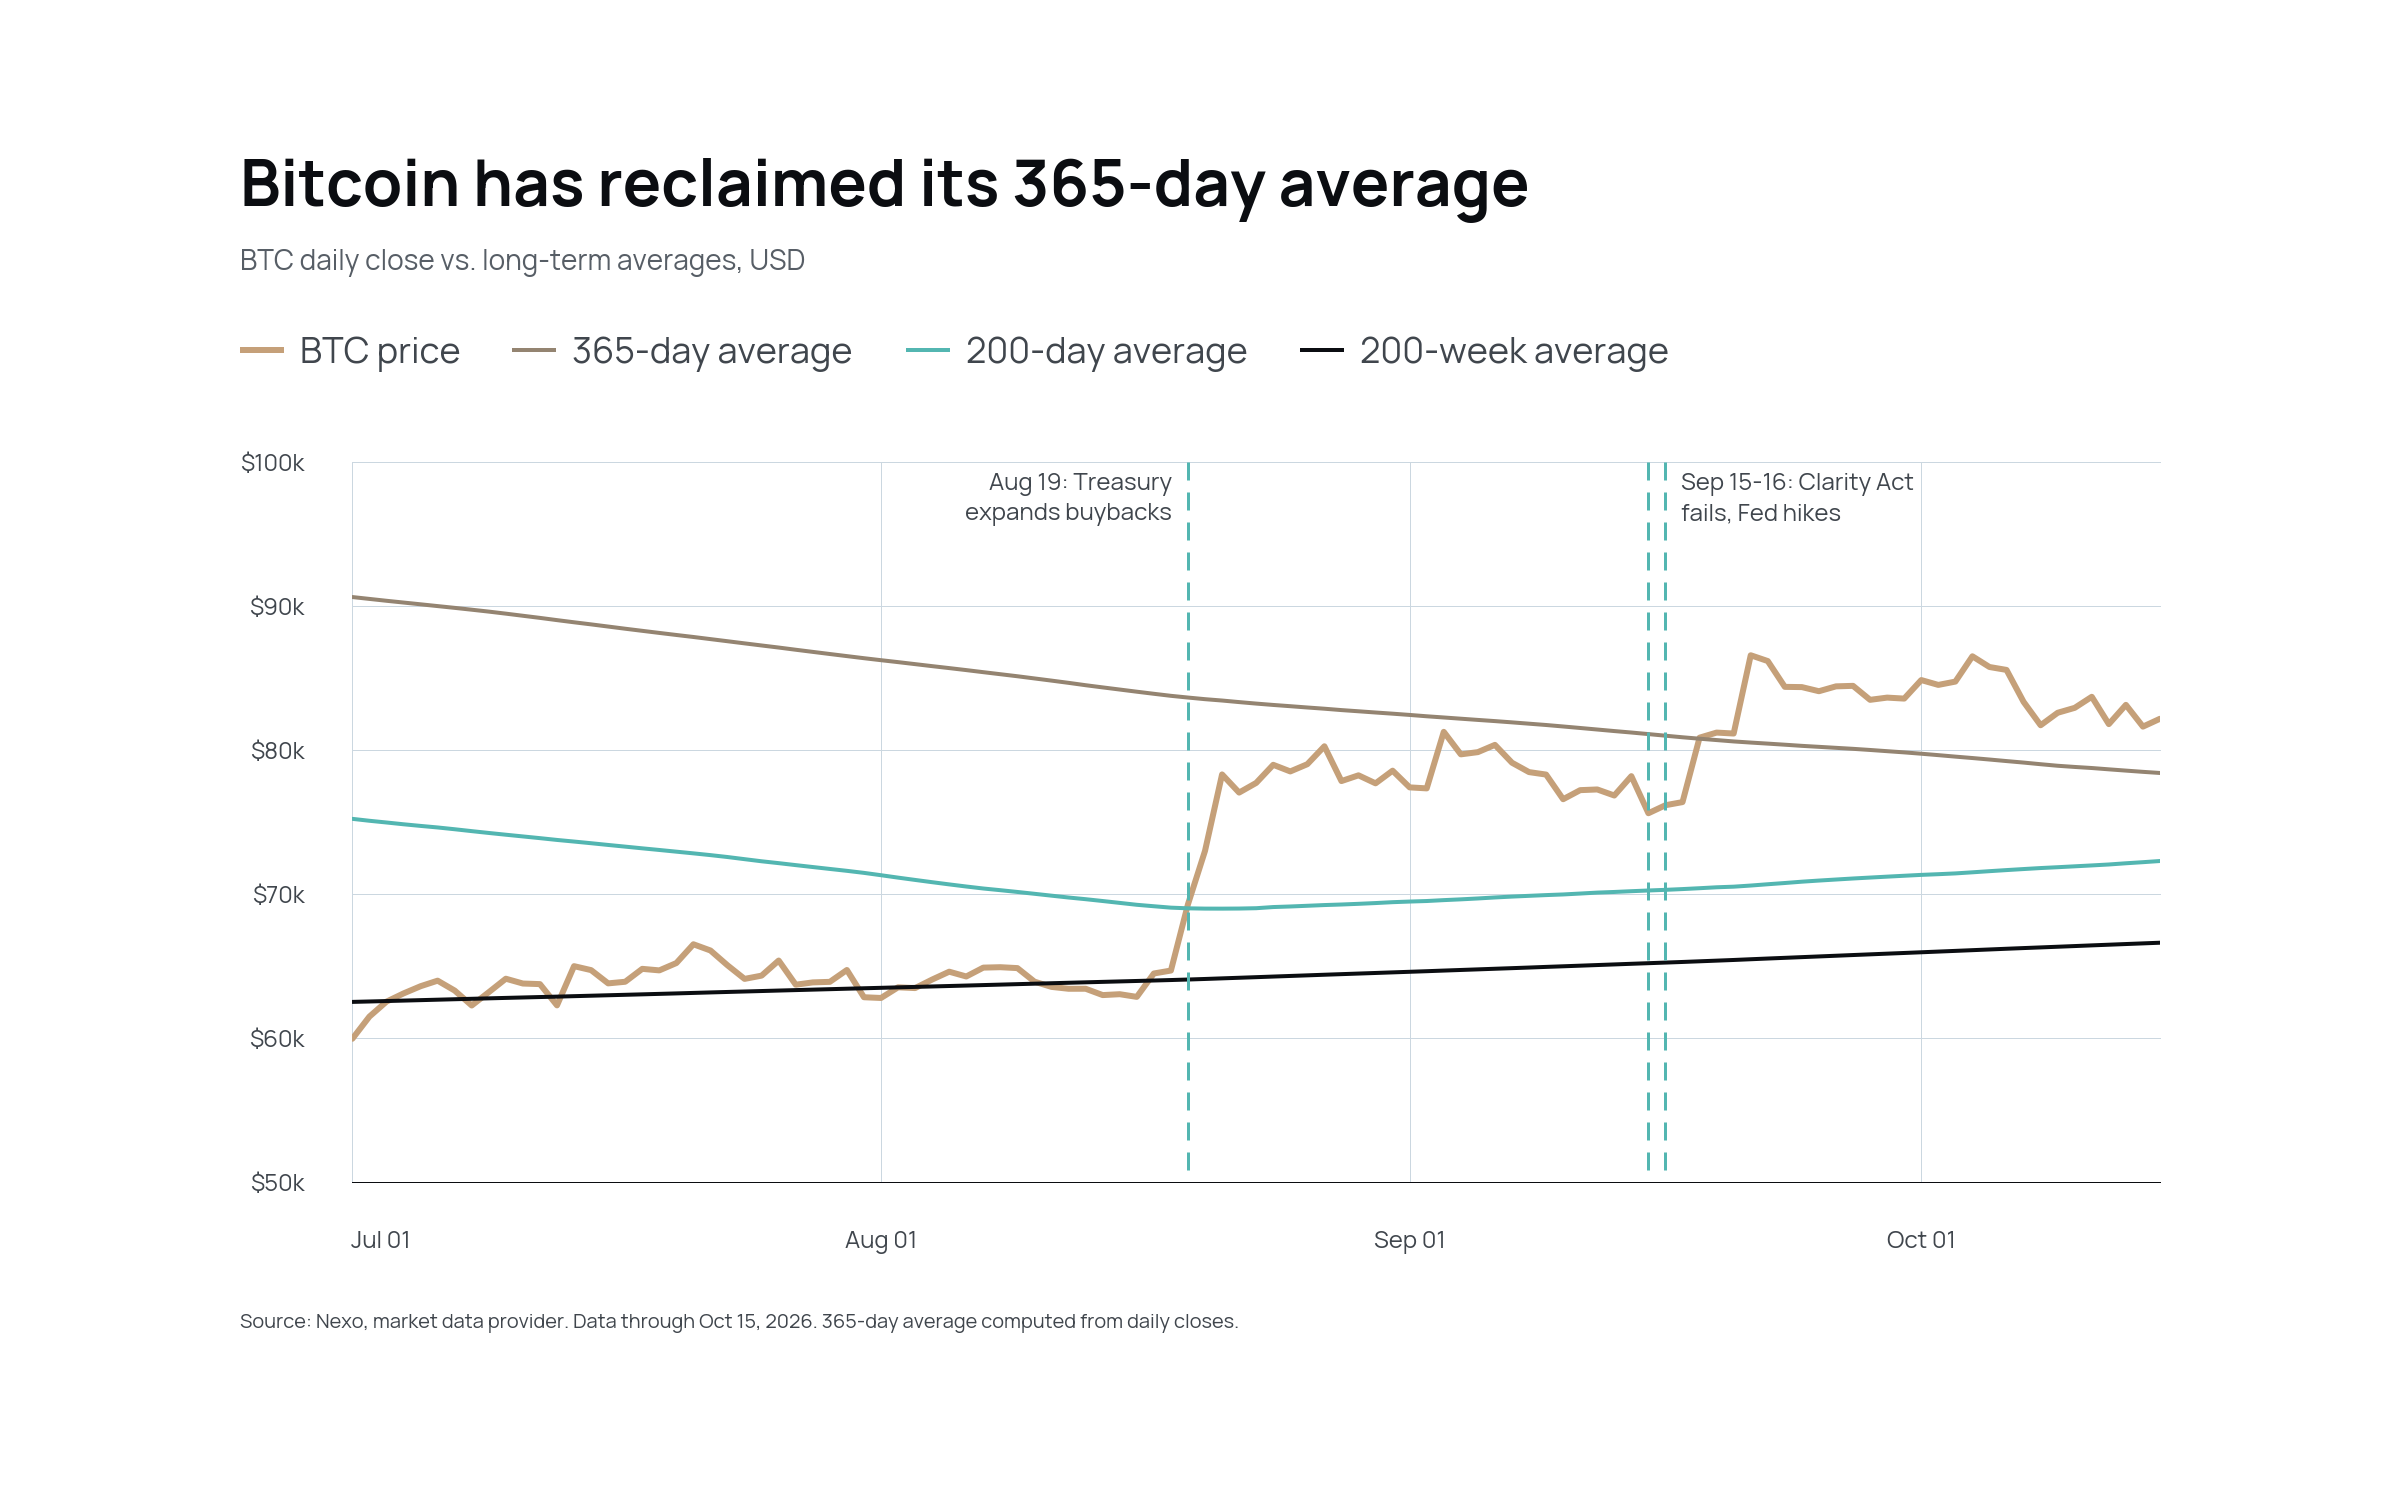
- The recovery began with a bond-market decision, not a crypto event. The US Treasury’s August 19 decision to double its long-dated bond buybacks lifted Bitcoin about 21% in three days as bearish positions unwound.
- It has outlived its trigger. Long-dated Treasury yields later rose to their highest in more than two decades, and the Fed, ECB and Bank of Japan all raised rates in September. Bitcoin still finished the month above $83,000.
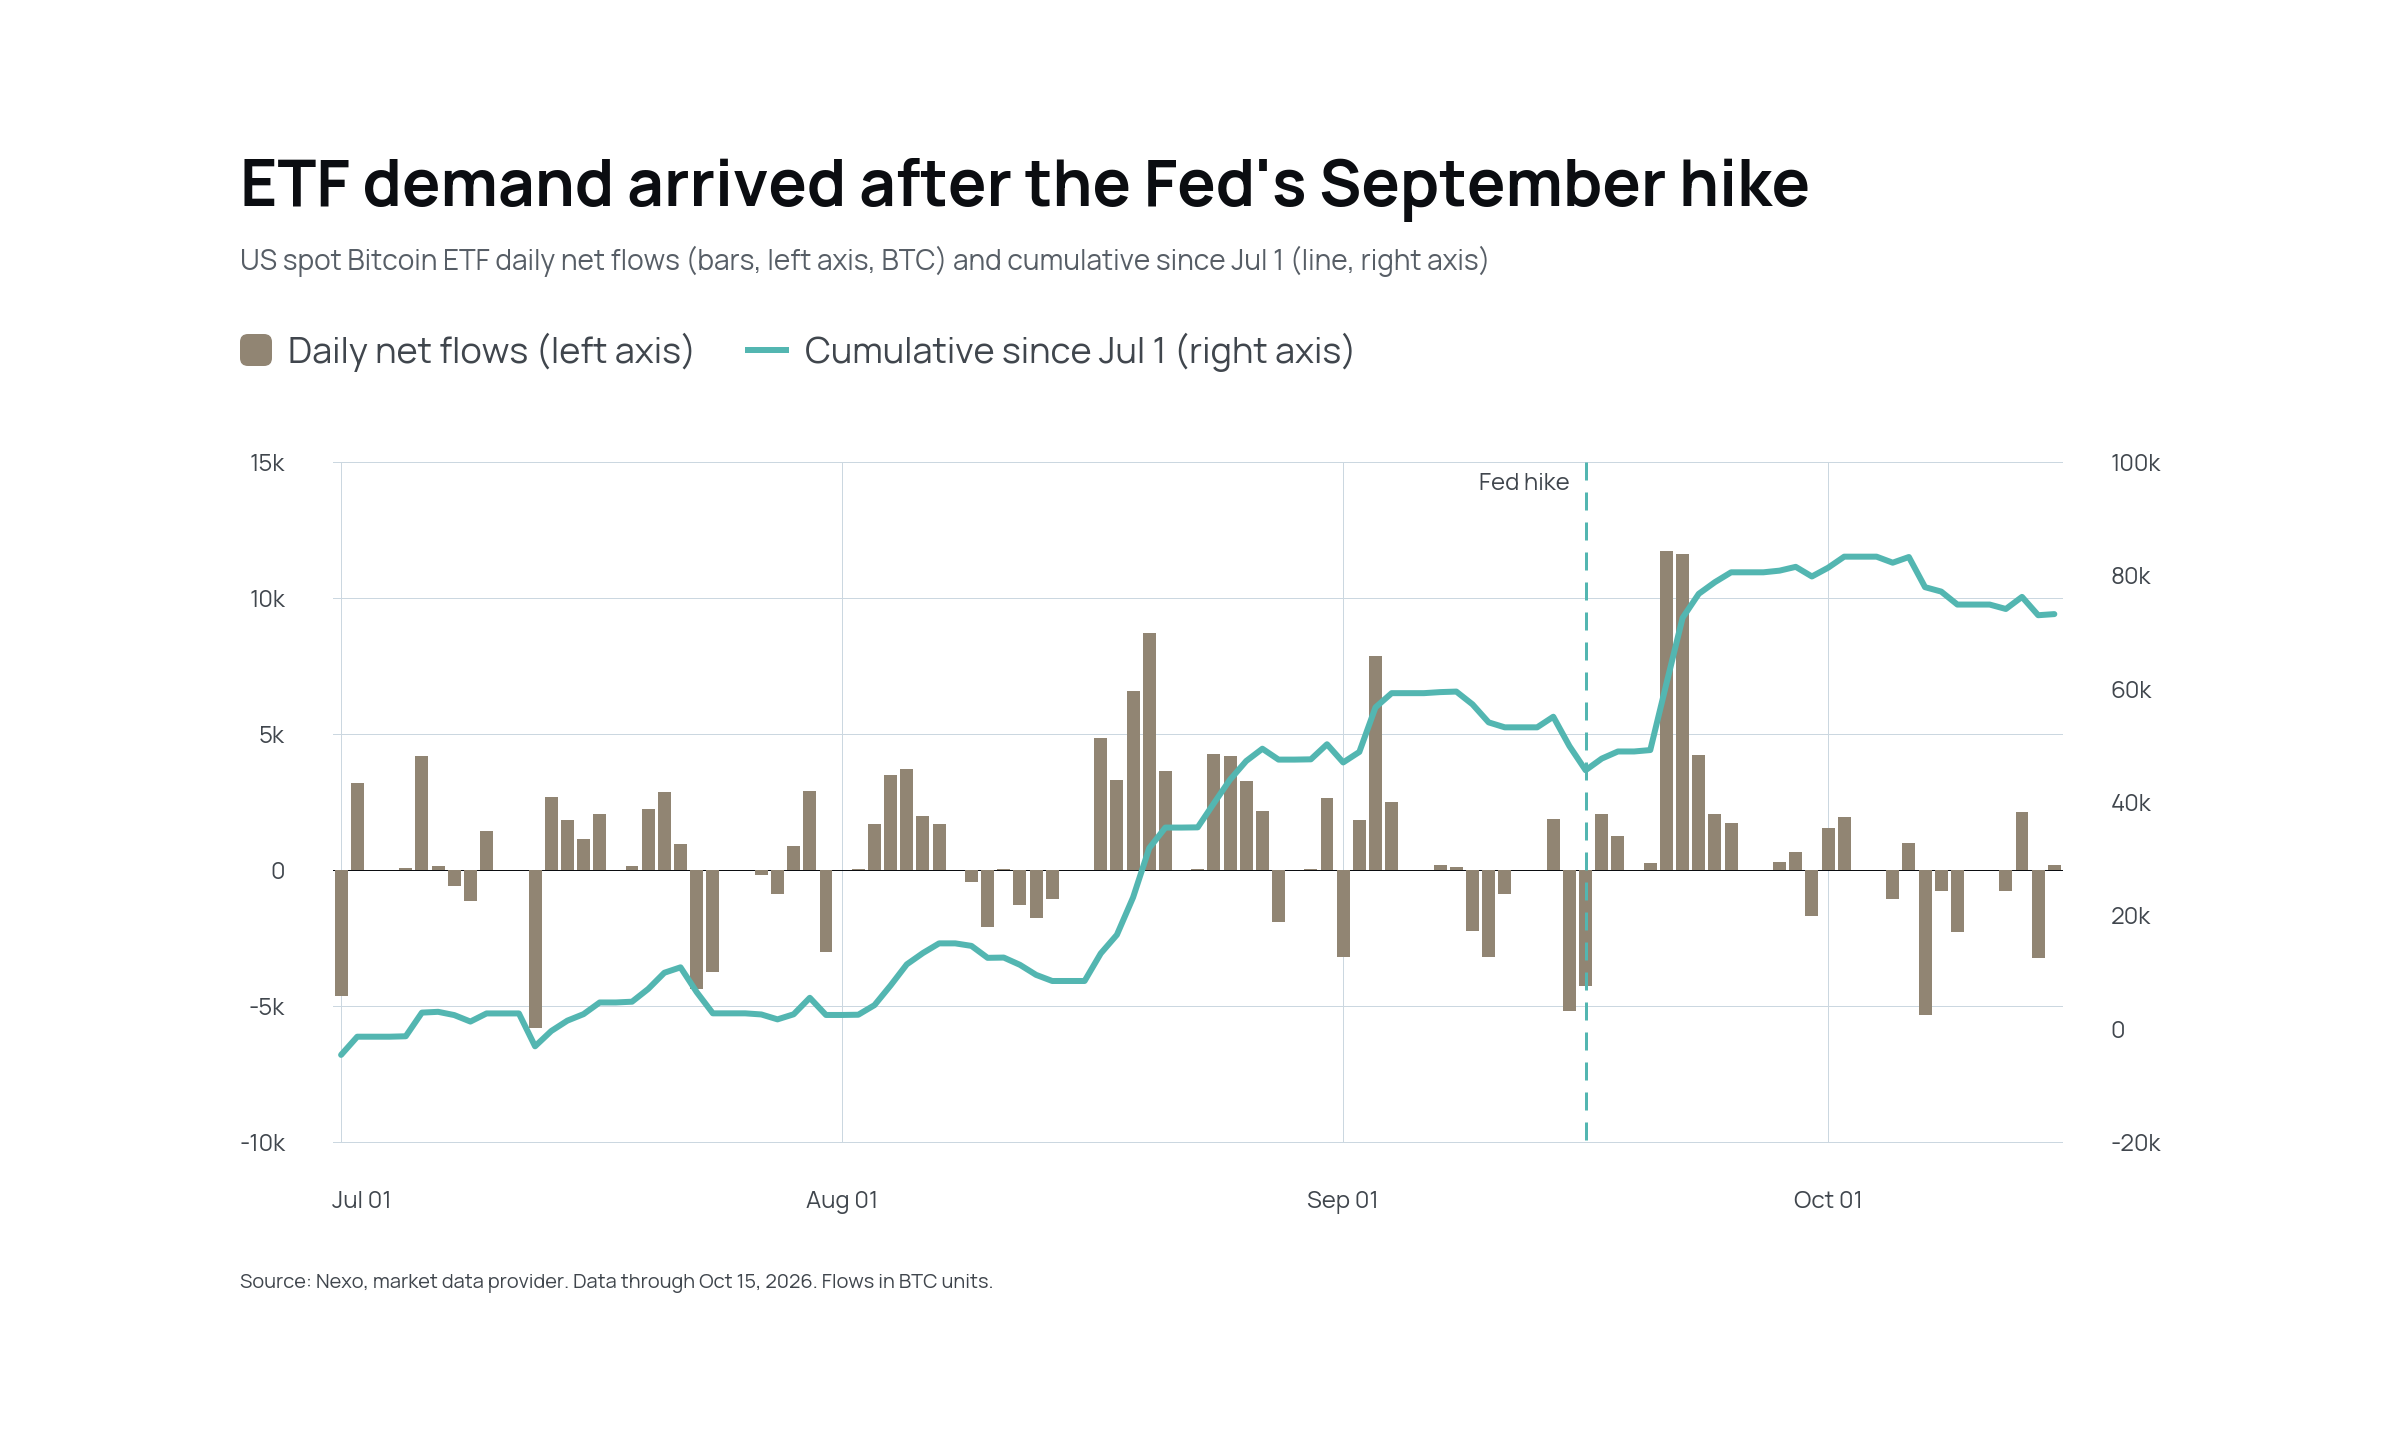
- Demand changed character. US spot Bitcoin ETFs took in $2.65 billion in September, all of it after the Fed’s hike, while leverage stayed near its long-run norm.
- Q4 outlook: constructive, but conditional on rates. Hotter-than-expected September inflation puts the Fed’s October 27–28 meeting and long-dated yields in focus as the swing factors. ETF demand and the $88,000–$90,000 area, where October call options cluster, decide how far a rally can run.
- Market structure is being built without Congress. After the Clarity Act failed 49–50 in the Senate, regulators and market infrastructure providers kept advancing tokenization and stablecoin rules.
1. Q4 Outlook
Constructive, conditional on rates
Bitcoin starts the fourth quarter on firmer footing. Selling eased through September, about 69% of supply is in profit, and September’s new demand came through ETFs rather than leverage, which makes the backdrop more constructive for investors, although ETF flows have turned to net outflows in October. The main condition is interest rates. With the 30-year Treasury yield at about 5.6%, a further rise would make safe government debt more attractive than Bitcoin. October is deciding which way this goes. The September inflation report on October 14 was hotter than expected, with CPI at 3.7% from a year earlier and core at 2.6%, and it put a second hike back in play. The Fed’s decision on October 28 now carries more weight: a hold would keep the outlook supportive, while a hike would make it cautious.
The technical picture
On the weekly chart, Bitcoin has formed a double bottom, a pattern technical analysts read as the end of a downtrend. The first low came in February–March 2026 and the second in June–July. In late September, the price closed above the pattern’s neckline near $82,000, and the next two weekly closes held above it, the latest being $83,695 on October 11. The weekly close on October 18, at about $80,900, fell back below it. Weekly patterns carry more weight and less noise than daily or intraday ones. That level matches the average cost of US ETF holders (about $82,300), which makes it the line the market is testing. The first weekly close back below the neckline is a warning, not a verdict: the breakout fails if lower weekly closes follow and the price falls below $80,000. A weekly close back above $82,000 would restore the case for the expected target of around $105,000–$110,000. Ether and Solana show similar weekly patterns, with their breakouts coming in late August.
Cycle timing adds a note of caution. In the last three cycles, Bitcoin’s low came 513–542 days before the halving, which points to late October to late November 2026 this time, with the next halving expected around April 2028. The June 2026 low came earlier and was shallower, a 53% decline against 77–85% in earlier cycles, so a retest inside that window is possible. Three cycles are a small sample, and ETF demand may change how this one behaves.
What will move the market?
Seven factors will shape the quarter, each in a different way. Two set the direction: inflation and the Fed, and long-dated Treasury yields. Three show how much conviction sits behind any move: ETF demand, holder selling, and leverage. Two are background: regulation and the Ethereum and altcoin complex, which tend to follow Bitcoin more than lead it. The table sets out where each stands, our read, and what would change it.
.png)
These factors combine into three possible paths, and October decides which one we are on. Markets currently price a Fed hold at about 68% (CME FedWatch, October 15), which supports the first two. A hike, priced at about 32% after peaking near 54% on the inflation report, is the clearest route to the third.
- Constructive (the upside case). Inflation data cools, the Fed holds in October, long-dated yields stabilize, and ETF inflows resume. Weekly closes recover above $82,000, confirming the breakout, and Bitcoin tests the $88,000–$90,000 area on the way toward $105,000–$110,000.
- Consolidation (the current path). Data are mixed, and the Fed holds but keeps December open. ETF flows plateau, and price consolidates between its 365-day average (about $78,000) and the $88,000–$90,000 area.
- Setback (the largest risk). Hot inflation prints and a hawkish Fed push long-dated yields higher. ETF flows reverse, and further weekly closes below $82,000 mark a false breakout. Bitcoin falls below $80,000 and retests its 365-day average (about $78,000).
Likelihood labels are Nexo’s qualitative judgment, not probabilities. Technical levels describe chart patterns and are not a forecast or recommendation. Forward-looking views and scenarios are not a reliable indicator of future performance. Seasonality offers no protection: October has closed higher in most years since 2013, but last October marked the cycle peak.
Two signals to follow in Q4
The practical read is to follow whether inflation data lets the Fed hold, and whether the 30-year yield stops rising. If both turn supportive, ETF demand and positioning are likely to reinforce the move. If not, they matter much less.
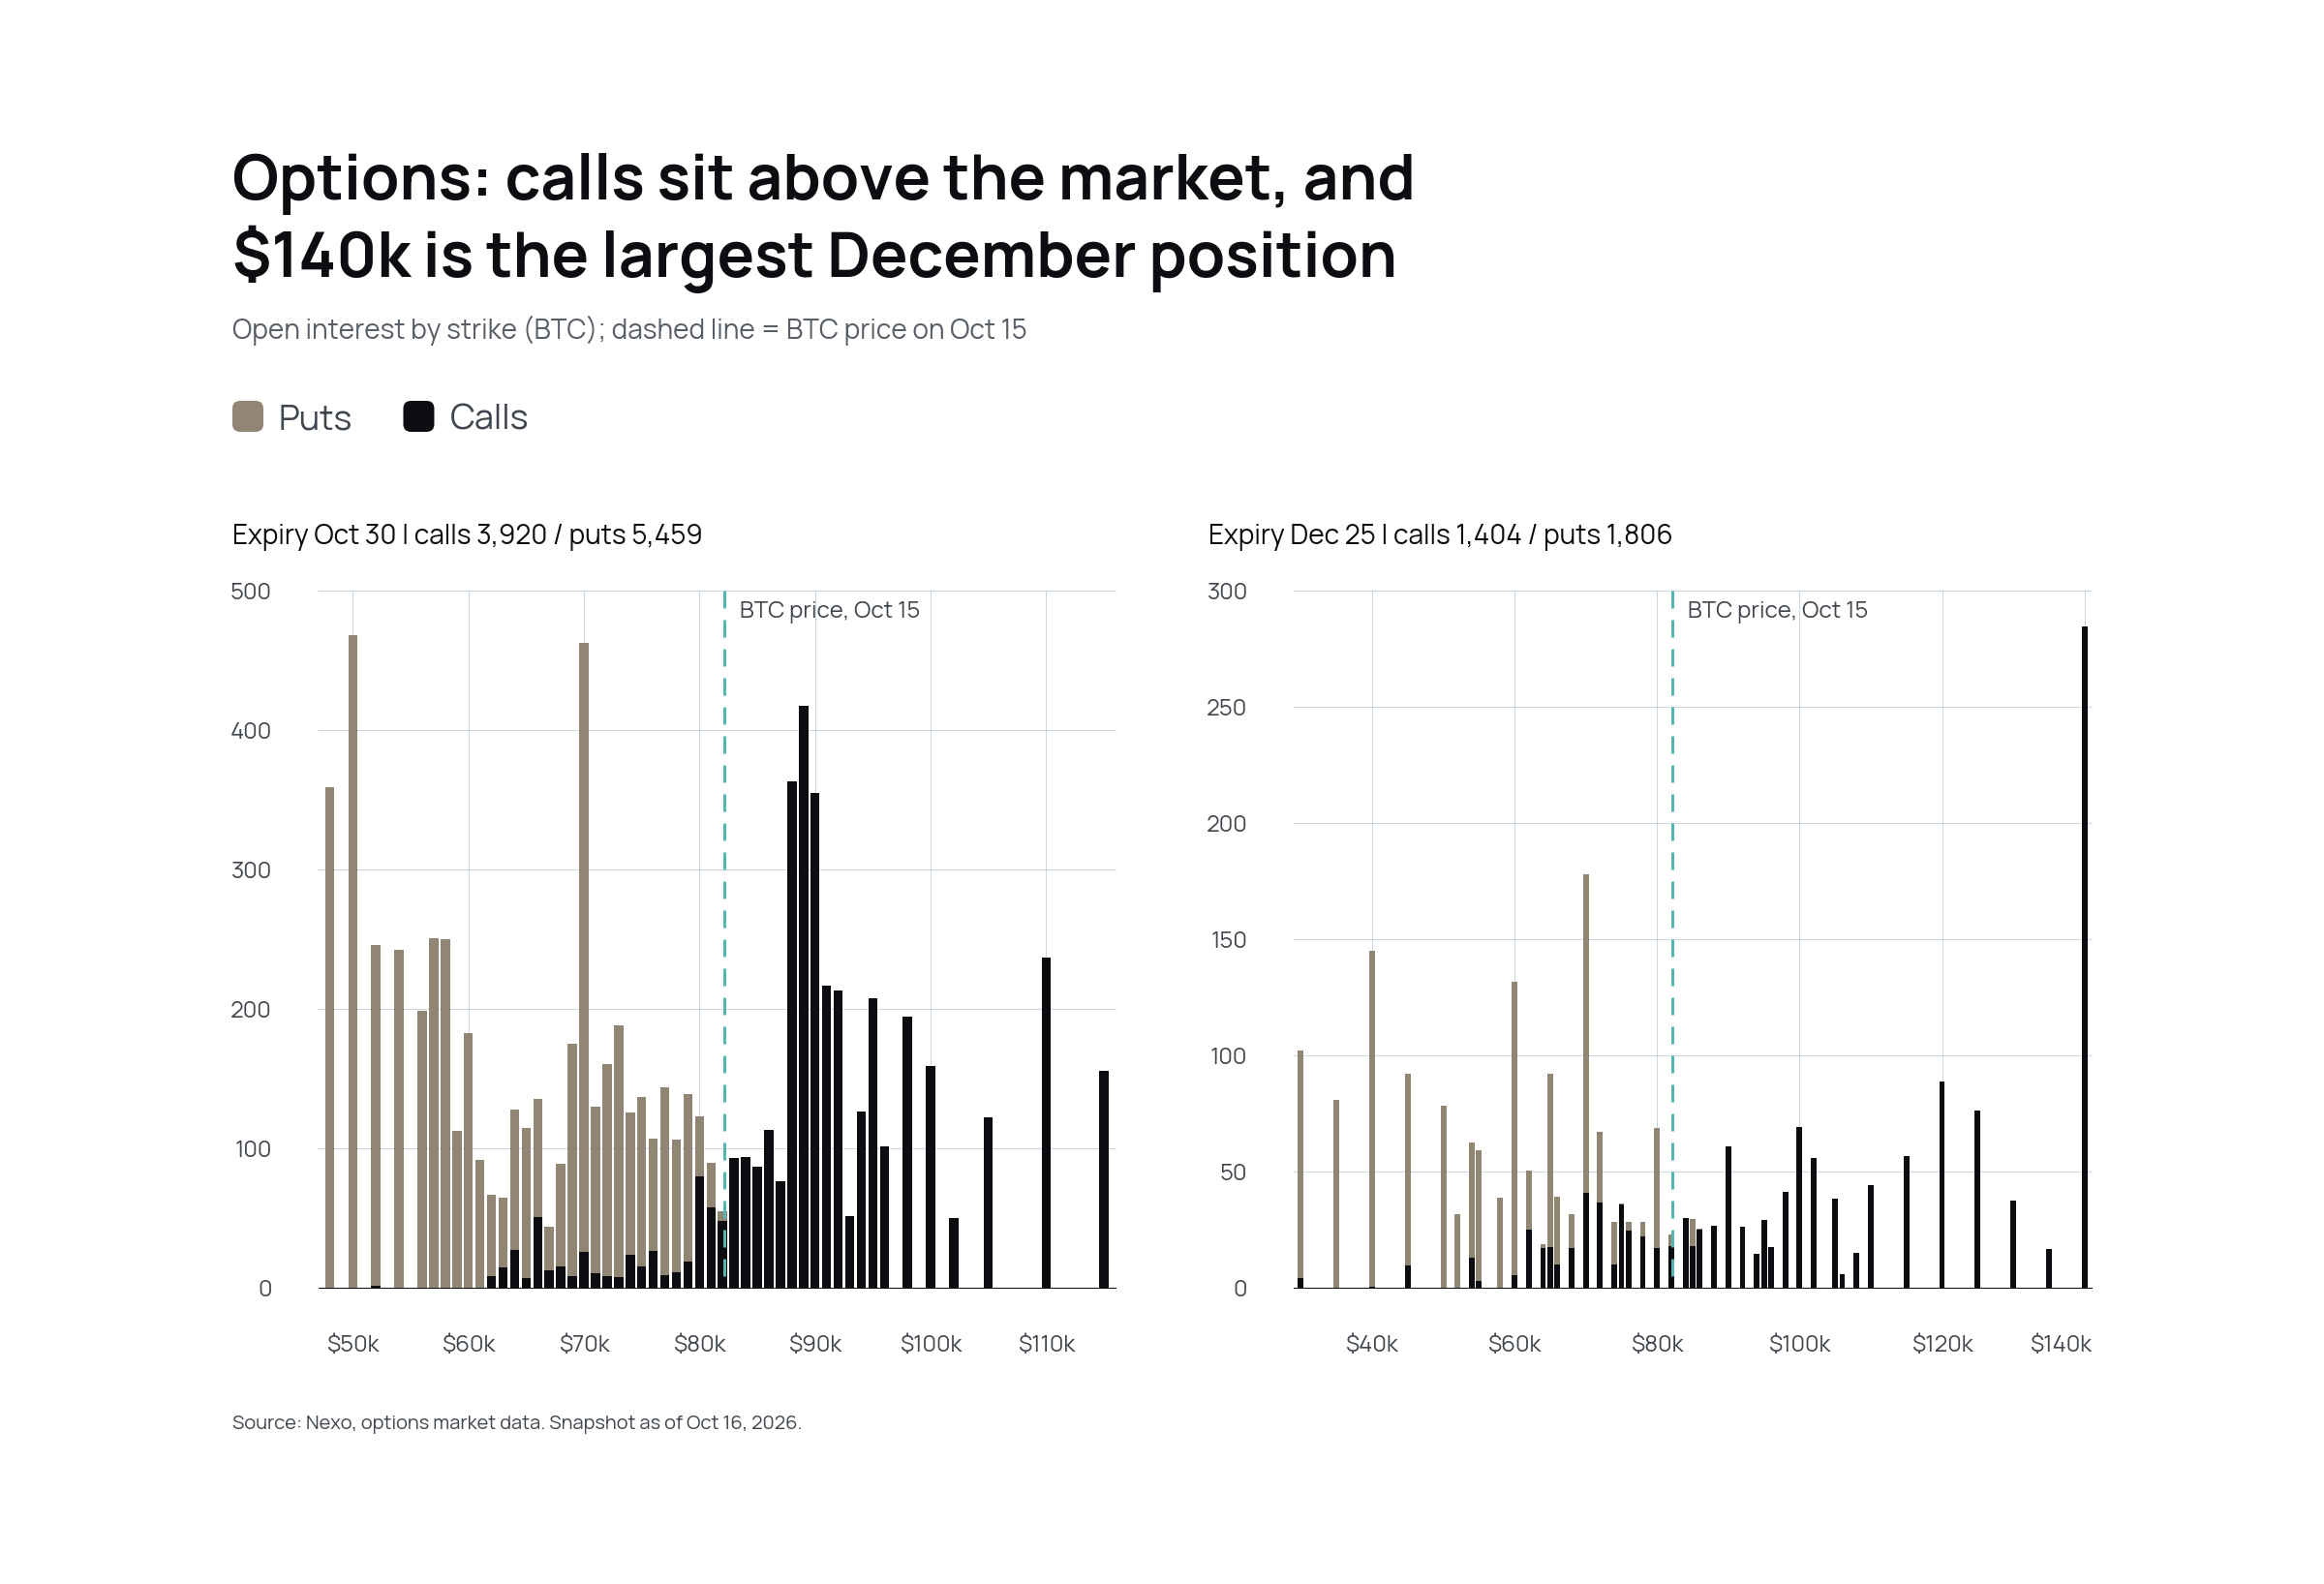
Options positioning reflects the same uncertainty. Traders are hedging: in the October 16 snapshot, open interest in puts exceeds calls for both the October 30 and December 25 expiries, and October puts cluster between $50,000 and $60,000 and around $70,000, well below the market. That is consistent with investors hedging against a sharp fall rather than expecting one. Calls cluster just above the market, at $88,000–$90,000. A few look much further out: the largest December position is 285 BTC of calls at $140,000, about 70% above the current price. It is one position, not a market view, but it shows some investors are positioned for a far stronger outcome if conditions turn favorable.
2. Key Events to Watch in Q4
Here is what market participants should anticipate this quarter. Inflation, growth and central-bank decisions shape what investors expect from interest rates, and those expectations drive prices across every asset class, Bitcoin included. October is the most telling month: its events will give guidance on what could lie ahead for monetary policy. Two longer-term milestones, in tokenization and stablecoin regulation, matter less for price this quarter and more for where the industry is heading. These are the events most likely to move markets this quarter.
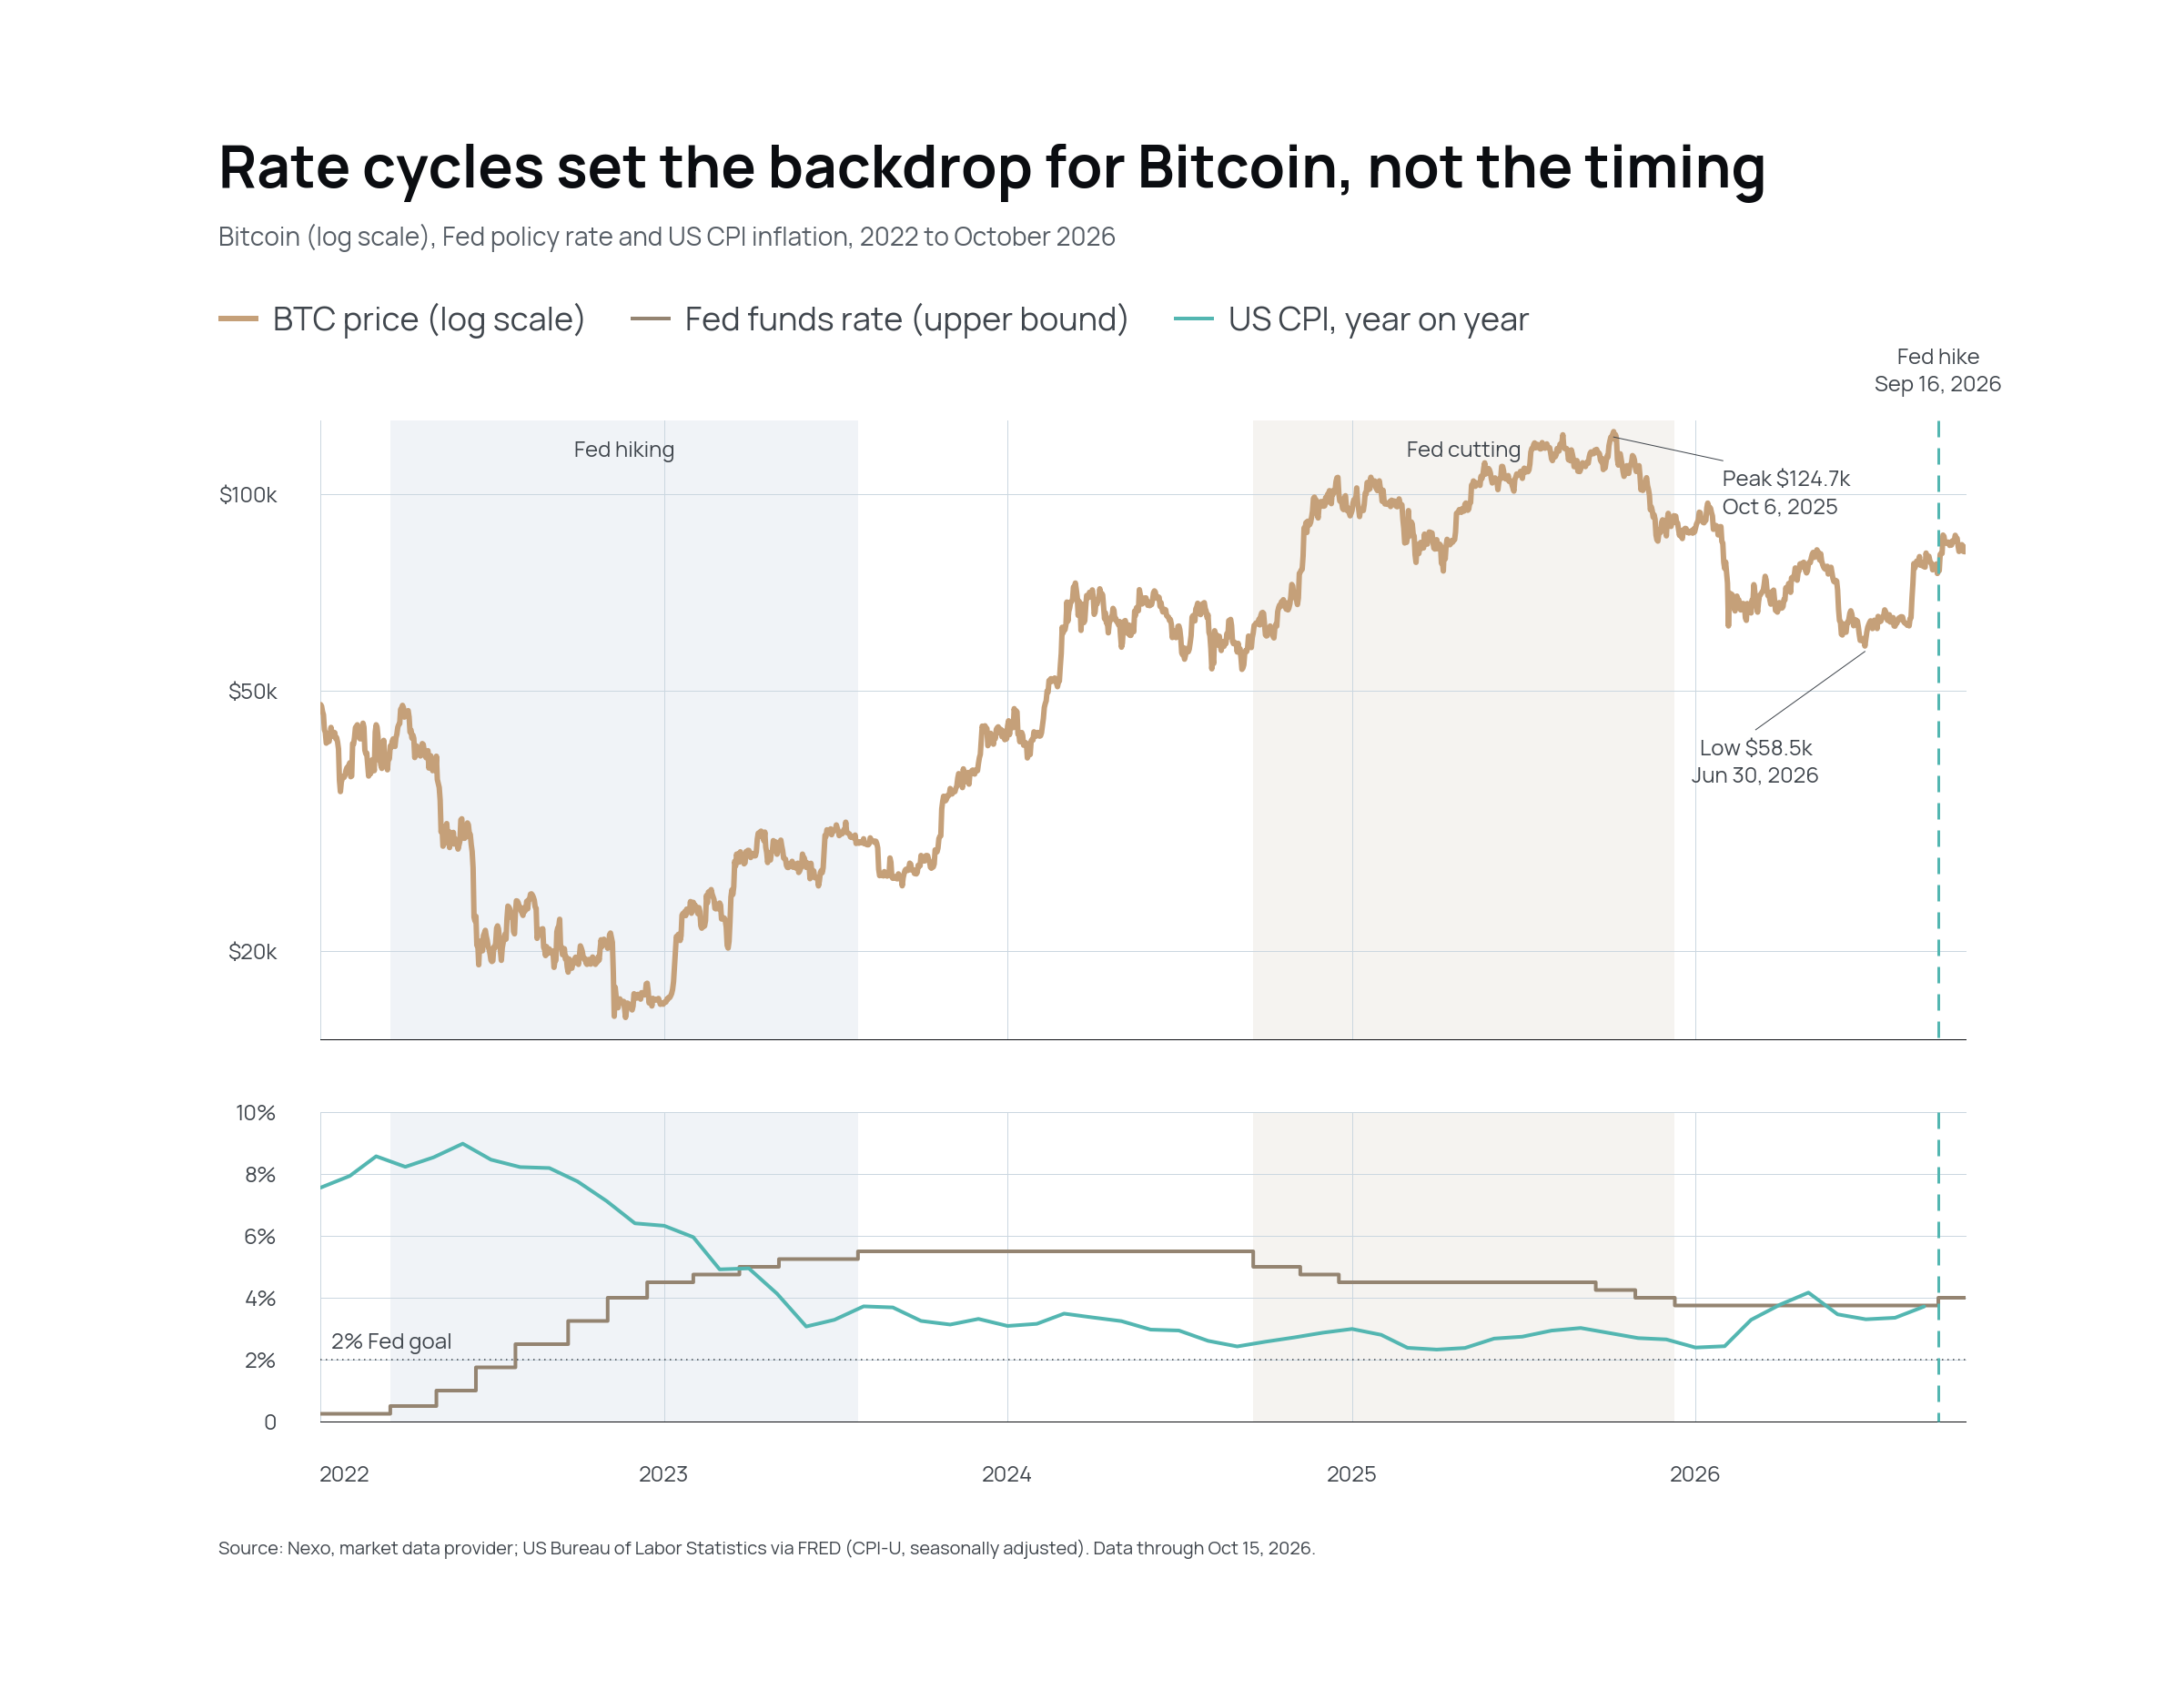
No CPI reading was published for October 2025 because of the federal government shutdown, so the line joins September and November. The 30-day comparison covers the 20 Fed hikes since December 2015.
What the chart shows: Over full cycles, Bitcoin has followed the direction of Fed policy: it fell through the 2022–23 hiking cycle and more than doubled in the 2024–25 cutting cycle. The timing is looser. Bitcoin peaked in October 2025 while the Fed was still cutting, and bottomed in June 2026 with rates on hold, weeks after inflation peaked at 4.2% in May.
Why it matters: The September hike turned policy from easing to tightening with inflation still above 3%. Bitcoin is up about 8% since, a break from the past: after 17 of the 20 Fed hikes since 2015, it was lower 30 days later. Whether the break holds depends on the data that follow, which is why the calendar below centers on inflation, growth and the Fed.
.png)
Key dates: market and structure
Corporate earnings: Late October brings third-quarter results from the largest US technology companies and from Strategy, the largest corporate holder of Bitcoin. Technology results help set risk appetite across markets, and Strategy’s update shows how corporate demand for Bitcoin is evolving.
Year-end positioning: December is typically a quieter month for trading volumes. Portfolio rebalancing and year-end reporting can shift positions in the second half of the month, and thin liquidity between December 26 and January 1 can exaggerate price moves as investors reposition for the first quarter.
.png)
Source: Bureau of Labor Statistics, BEA, Federal Reserve, US Treasury, Bank of Japan, company announcements, DTCC. Dates as published or announced as of Oct 16, 2026; dates marked TBC (highlighted) are not yet confirmed.
.png)
Past performance is not a reliable indicator of future results.
Bitcoin gained 7.3% in July, 25.0% in August and 6.4% in September. All three months closed higher, and the quarter ended the cycle of three consecutive down quarters. Bitcoin and the wider digital asset sector do not move in a vacuum. They are subject to the same macroeconomic forces as other markets but react in their own way: this quarter’s recovery began with a US Treasury decision, and ETF demand shaped how Bitcoin responded.
How the Q3 recovery unfolded
A signal from the bond market. Bitcoin opened the quarter near its low and spent seven weeks in the $60,000s. On August 19, the US Treasury said it would double its buybacks of long-dated bonds, from $2 billion to $4 billion per operation. The size was modest, and a buyback is not quantitative easing, but the 30-year yield, which had reached a 19-year high of 5.34%, began to fall. The relief did not last: by October 5, the yield was 5.66%. According to CoinDesk, about $4 billion of bearish crypto positions were liquidated over two days, and Bitcoin rose from $64,700 to above $78,000 in three sessions.
Shocks absorbed. In September, the Fed raised rates for the first time since 2023, the Bank of Japan raised to a 31-year high, and the Senate’s Clarity Act failed 49–50. Bitcoin briefly traded near $75,000 and was back above $80,000 within days, reaching $87,300 on September 21.
Buyers replaced short-covering. US spot Bitcoin ETFs took in $2.65 billion in September, the second-largest month since October 2025, and net inflows were concentrated after the Fed’s hike. Long-term holders slowed their selling to under a third of the late-August pace, and perpetual futures funding stayed around its long-run median, so leverage was not driving the move.
Market structure in Q3
Bitcoin’s price reclaimed its 365-day average in September after ten months below it. The last break above it, in March 2023, marked the start of that rally. By Glassnode’s measure, Bitcoin never closed a day below the Realized Price, the average cost basis of all coins, now about $53,900. JPMorgan estimates miners’ production cost near $85,000; Bitcoin spent 280 days below it before moving above it in late September; it has since traded back below.
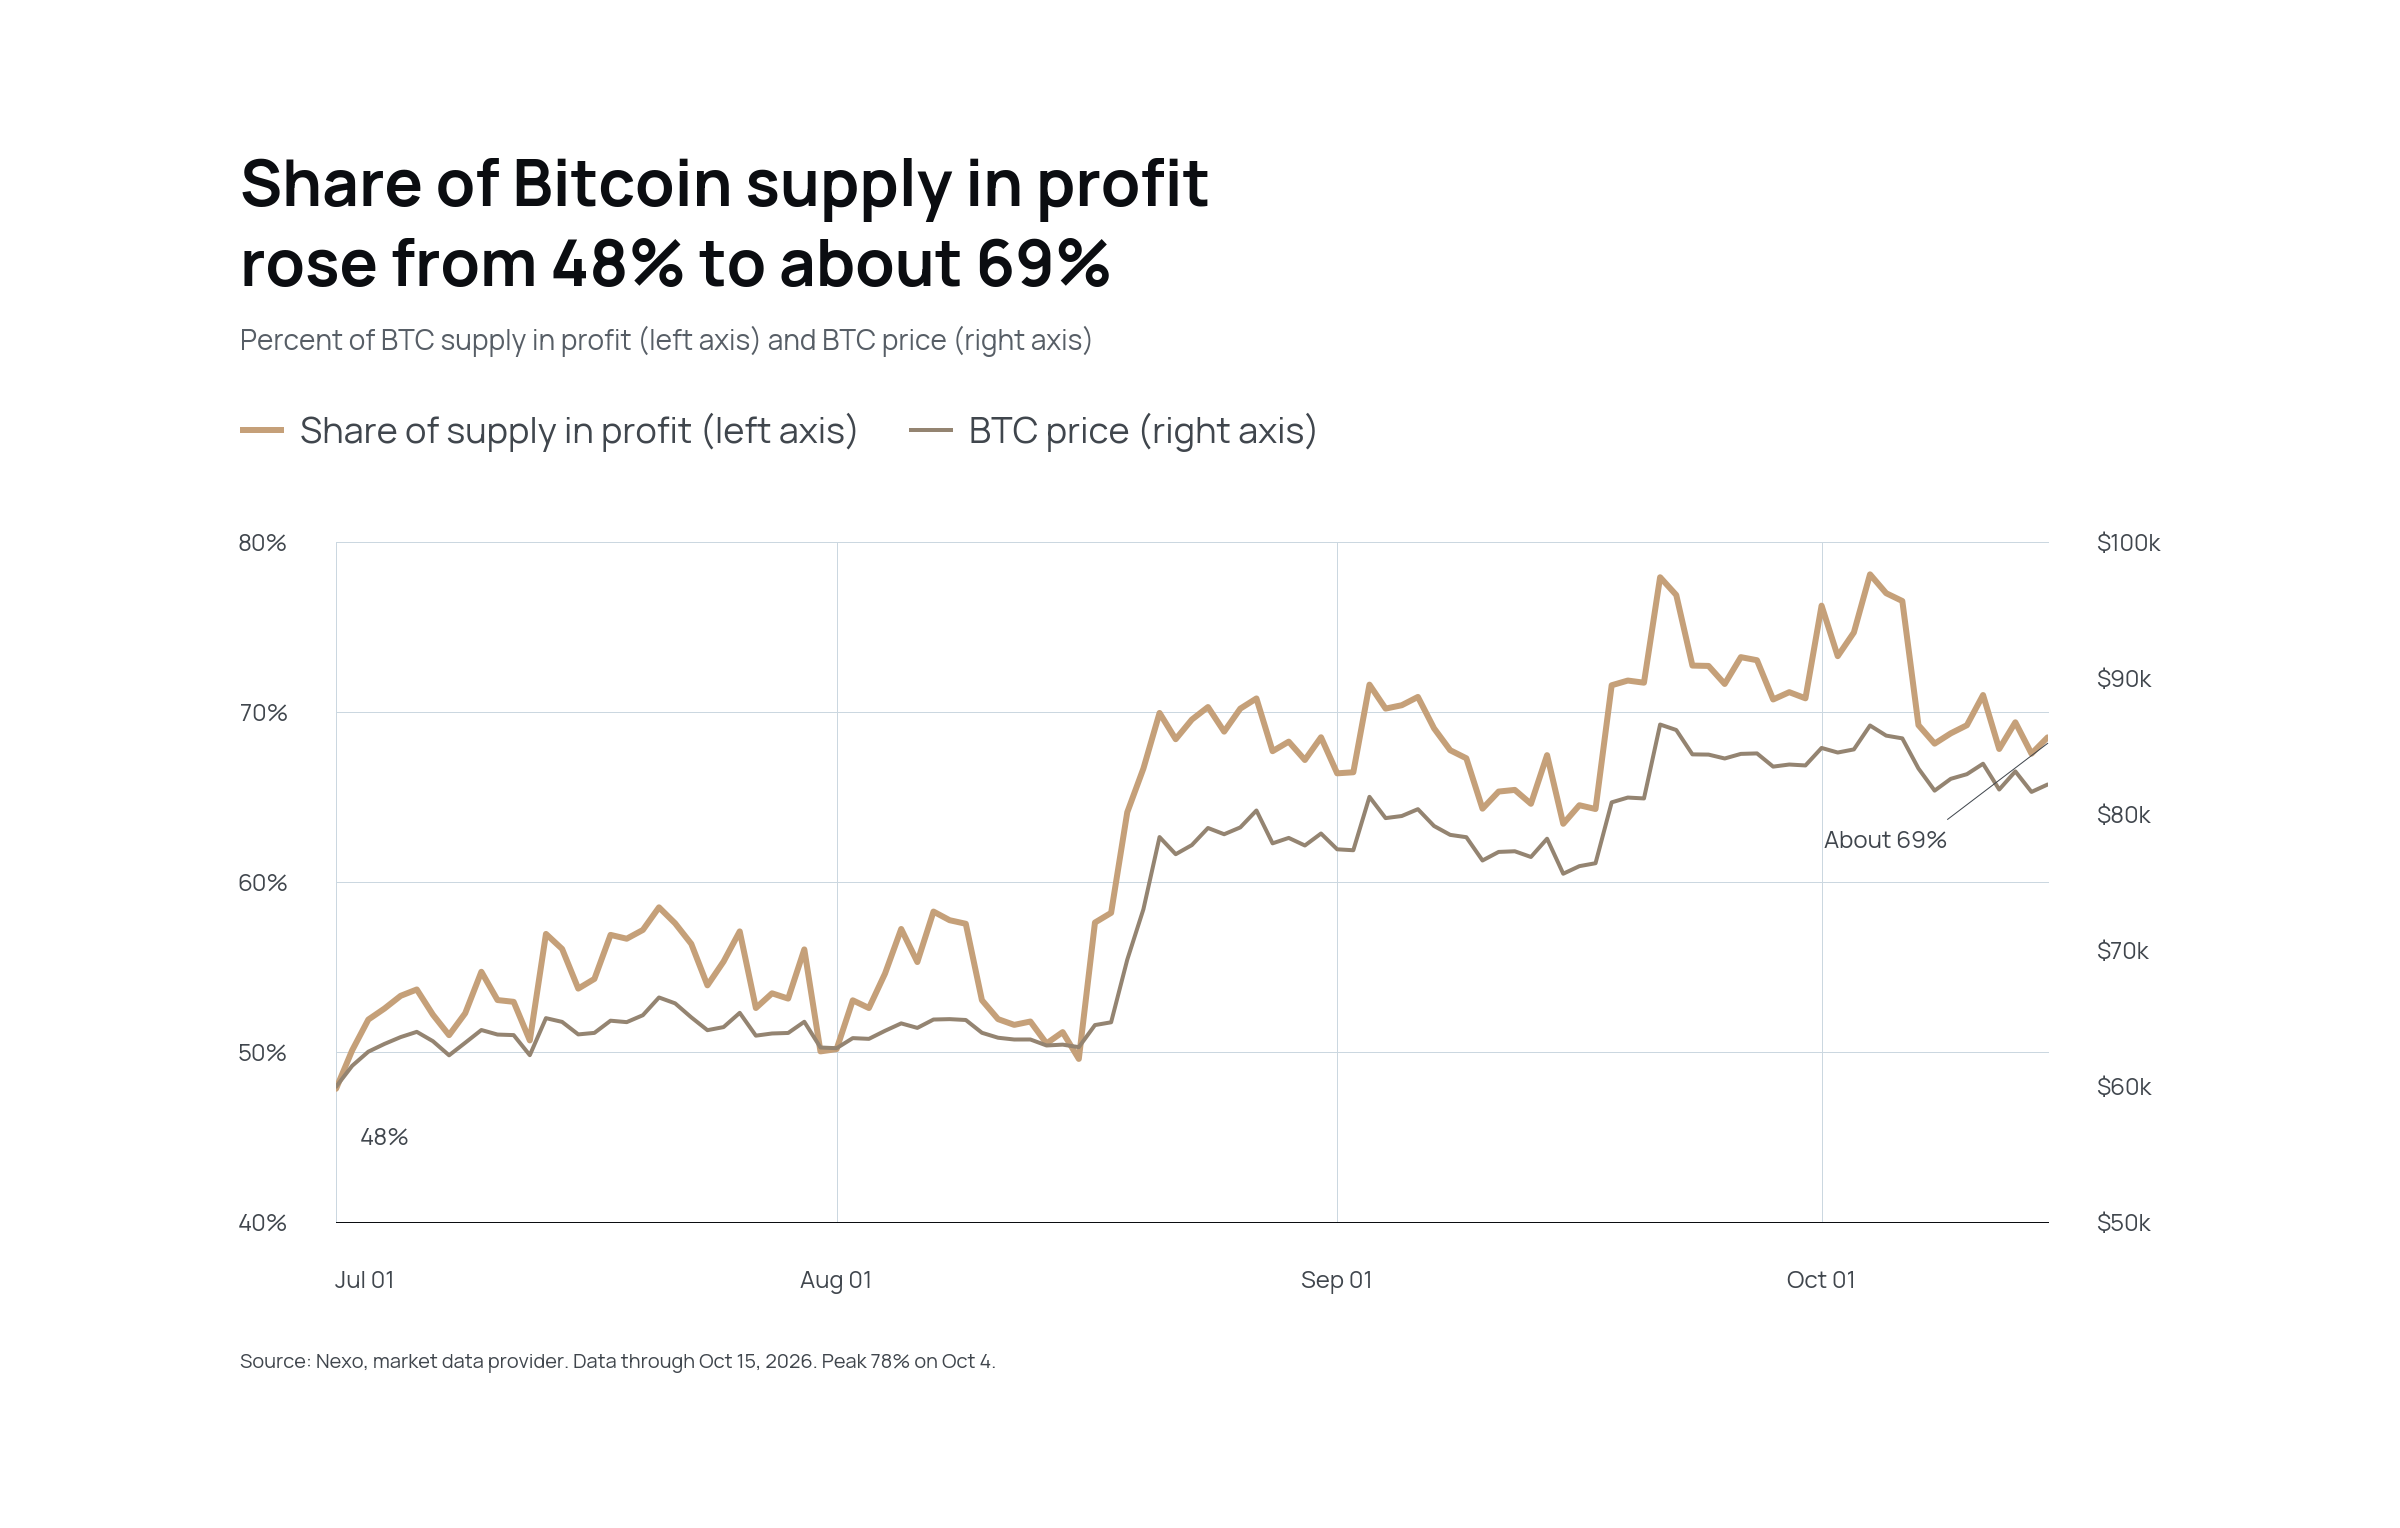
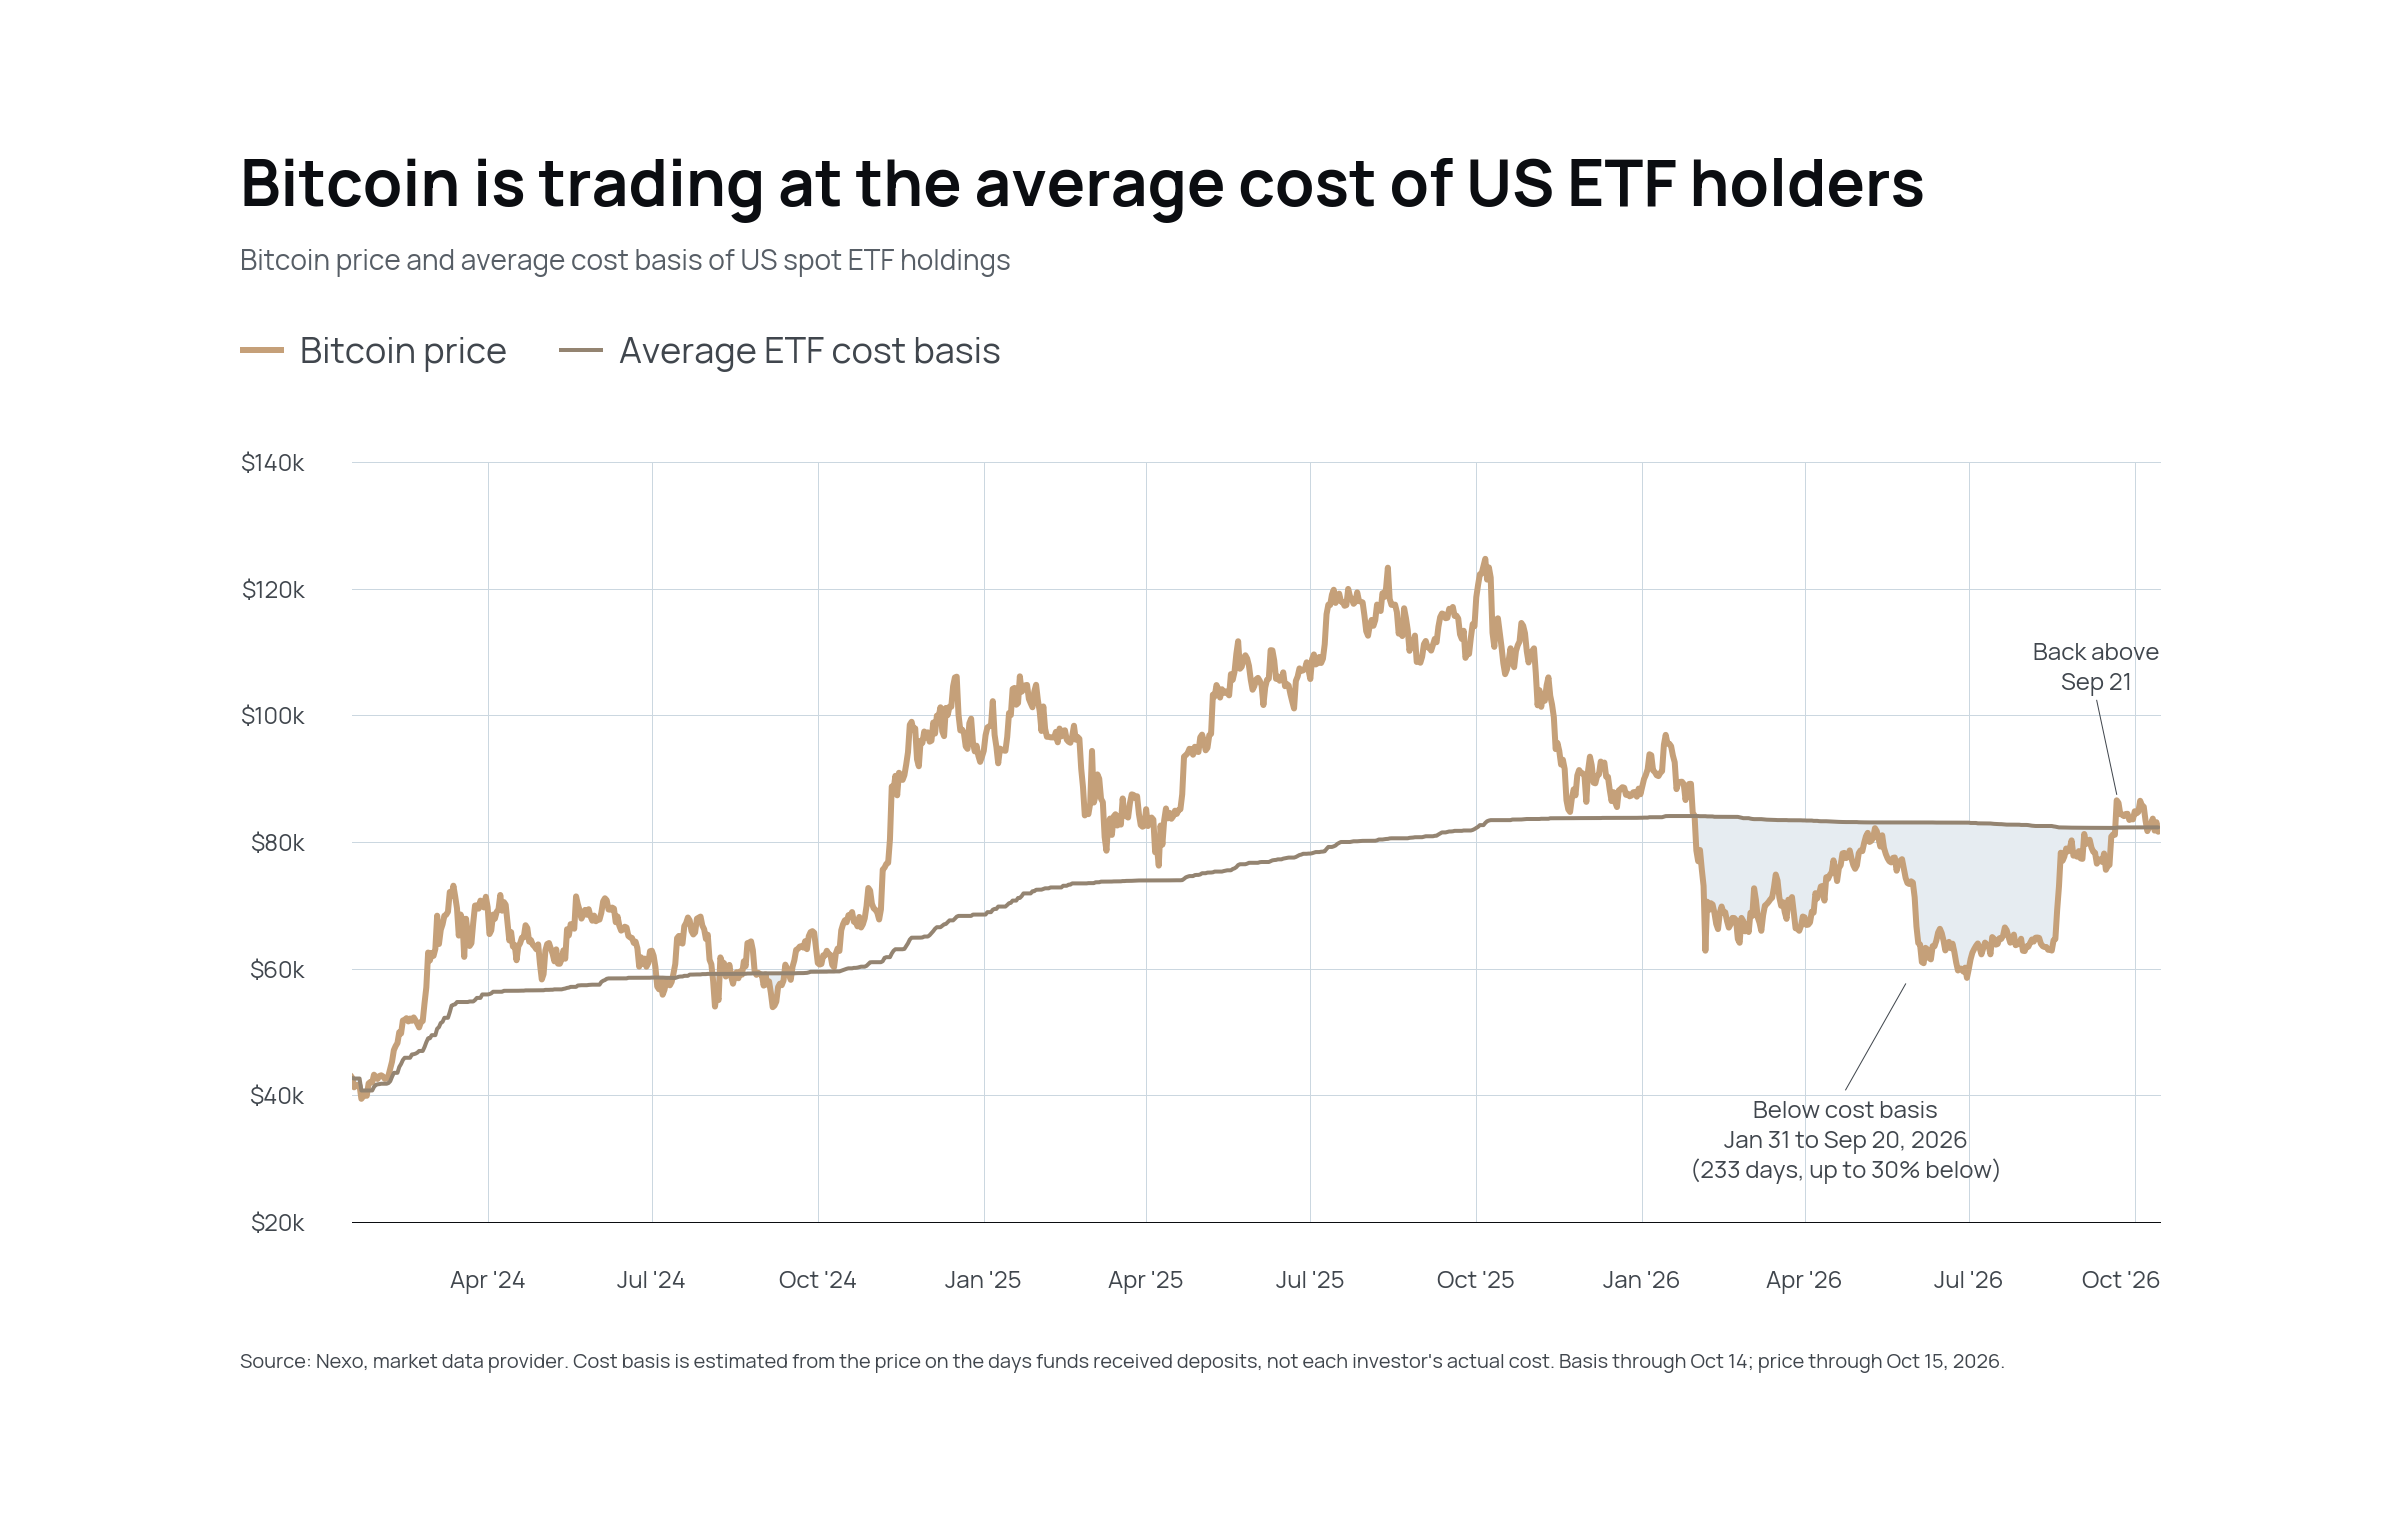
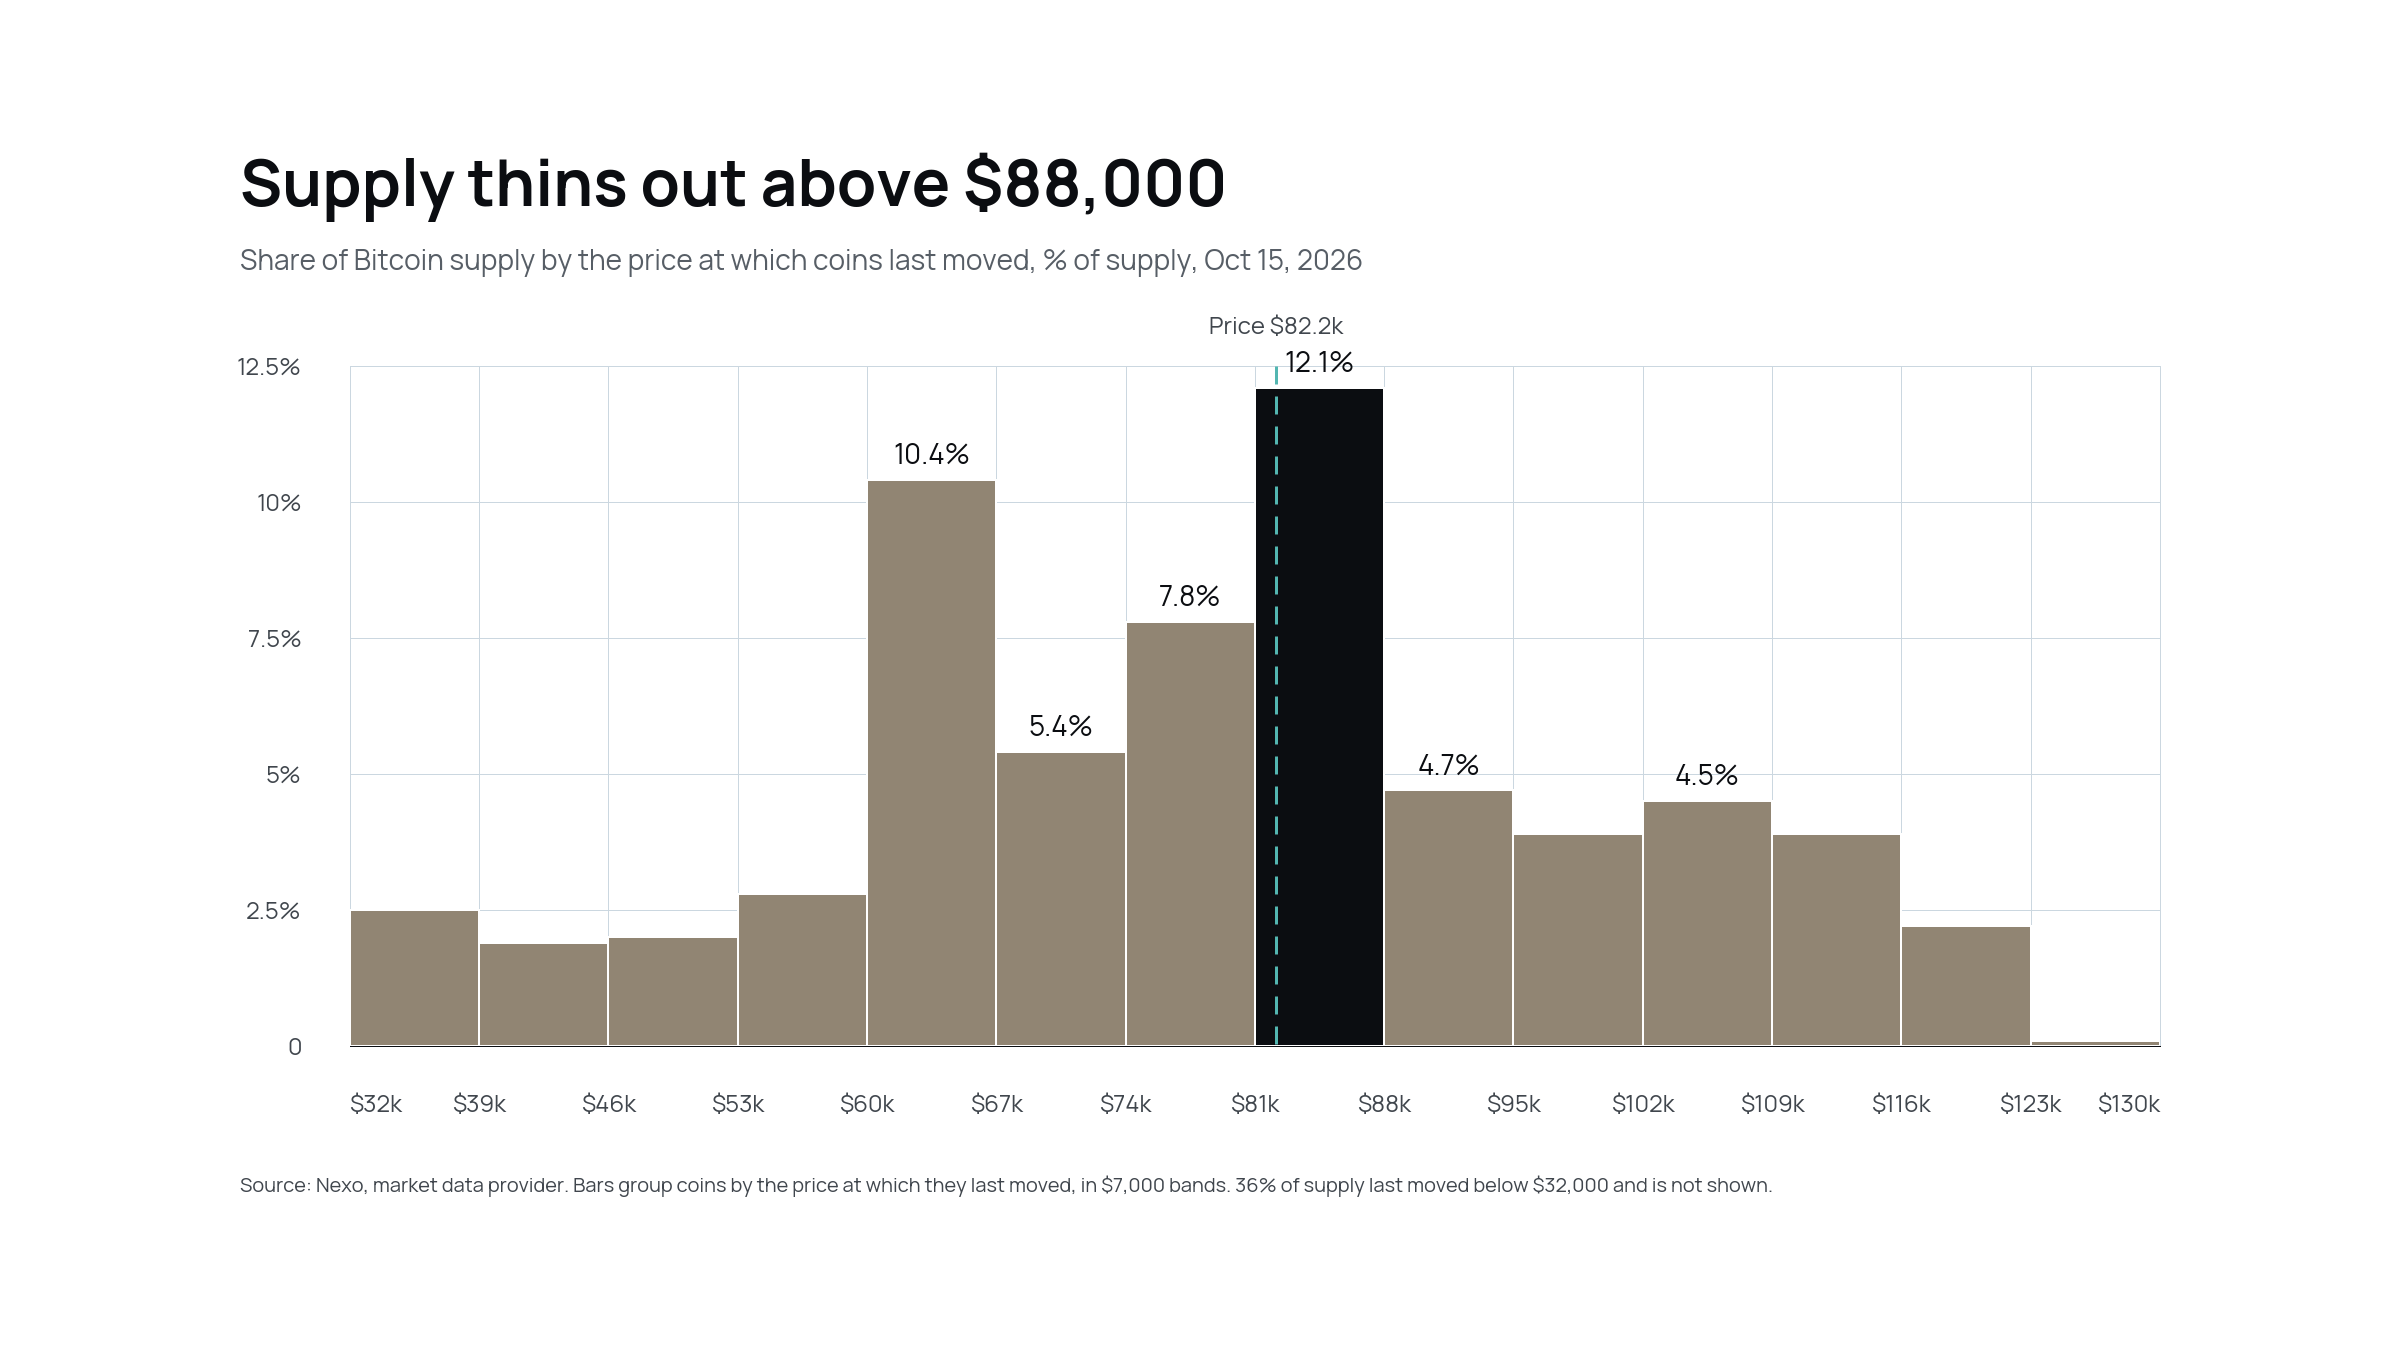
Two measures show where investors’ costs sit against today’s price, and both describe a market that has only just returned to even. US spot ETF holders paid an average of about $82,300 per Bitcoin, and Bitcoin closed below that level for most of 2026, at one point 30% below it. It now trades at about that level, having closed below it on October 8, 12 and 14. Across all holders, the share of supply held at a profit rose from 46% at the June low to about 69%. A dense band of holder costs, 12% of supply, sits between $81,000 and $88,000, around today’s price, while only about 5% sits between $88,000 and $95,000. The market is therefore trading through a crowded zone with little supply above it that would sell at breakeven. The ETF buyers’ breakeven of about $82,000 is the level to watch on the downside.
Altcoins in Q3
Altcoins joined the rally broadly: by Glassnode’s count, more than 70% of tracked altcoins outperformed Bitcoin in the week to September 21, with little increase in leverage. Ether’s quarter was its best since early 2021. US ether ETFs took in about $860 million in September, below August’s $1.86 billion, and flows turned negative late in the month. Solana ETFs took in about $250 million, and its network cut slot times to 250ms. Smaller tokens such as NEAR, whose first US spot ETF began trading on September 29 with about $36 million in net flows, moved sharply but carry more risk of reversal.
Macro: central banks tightened into an energy shock
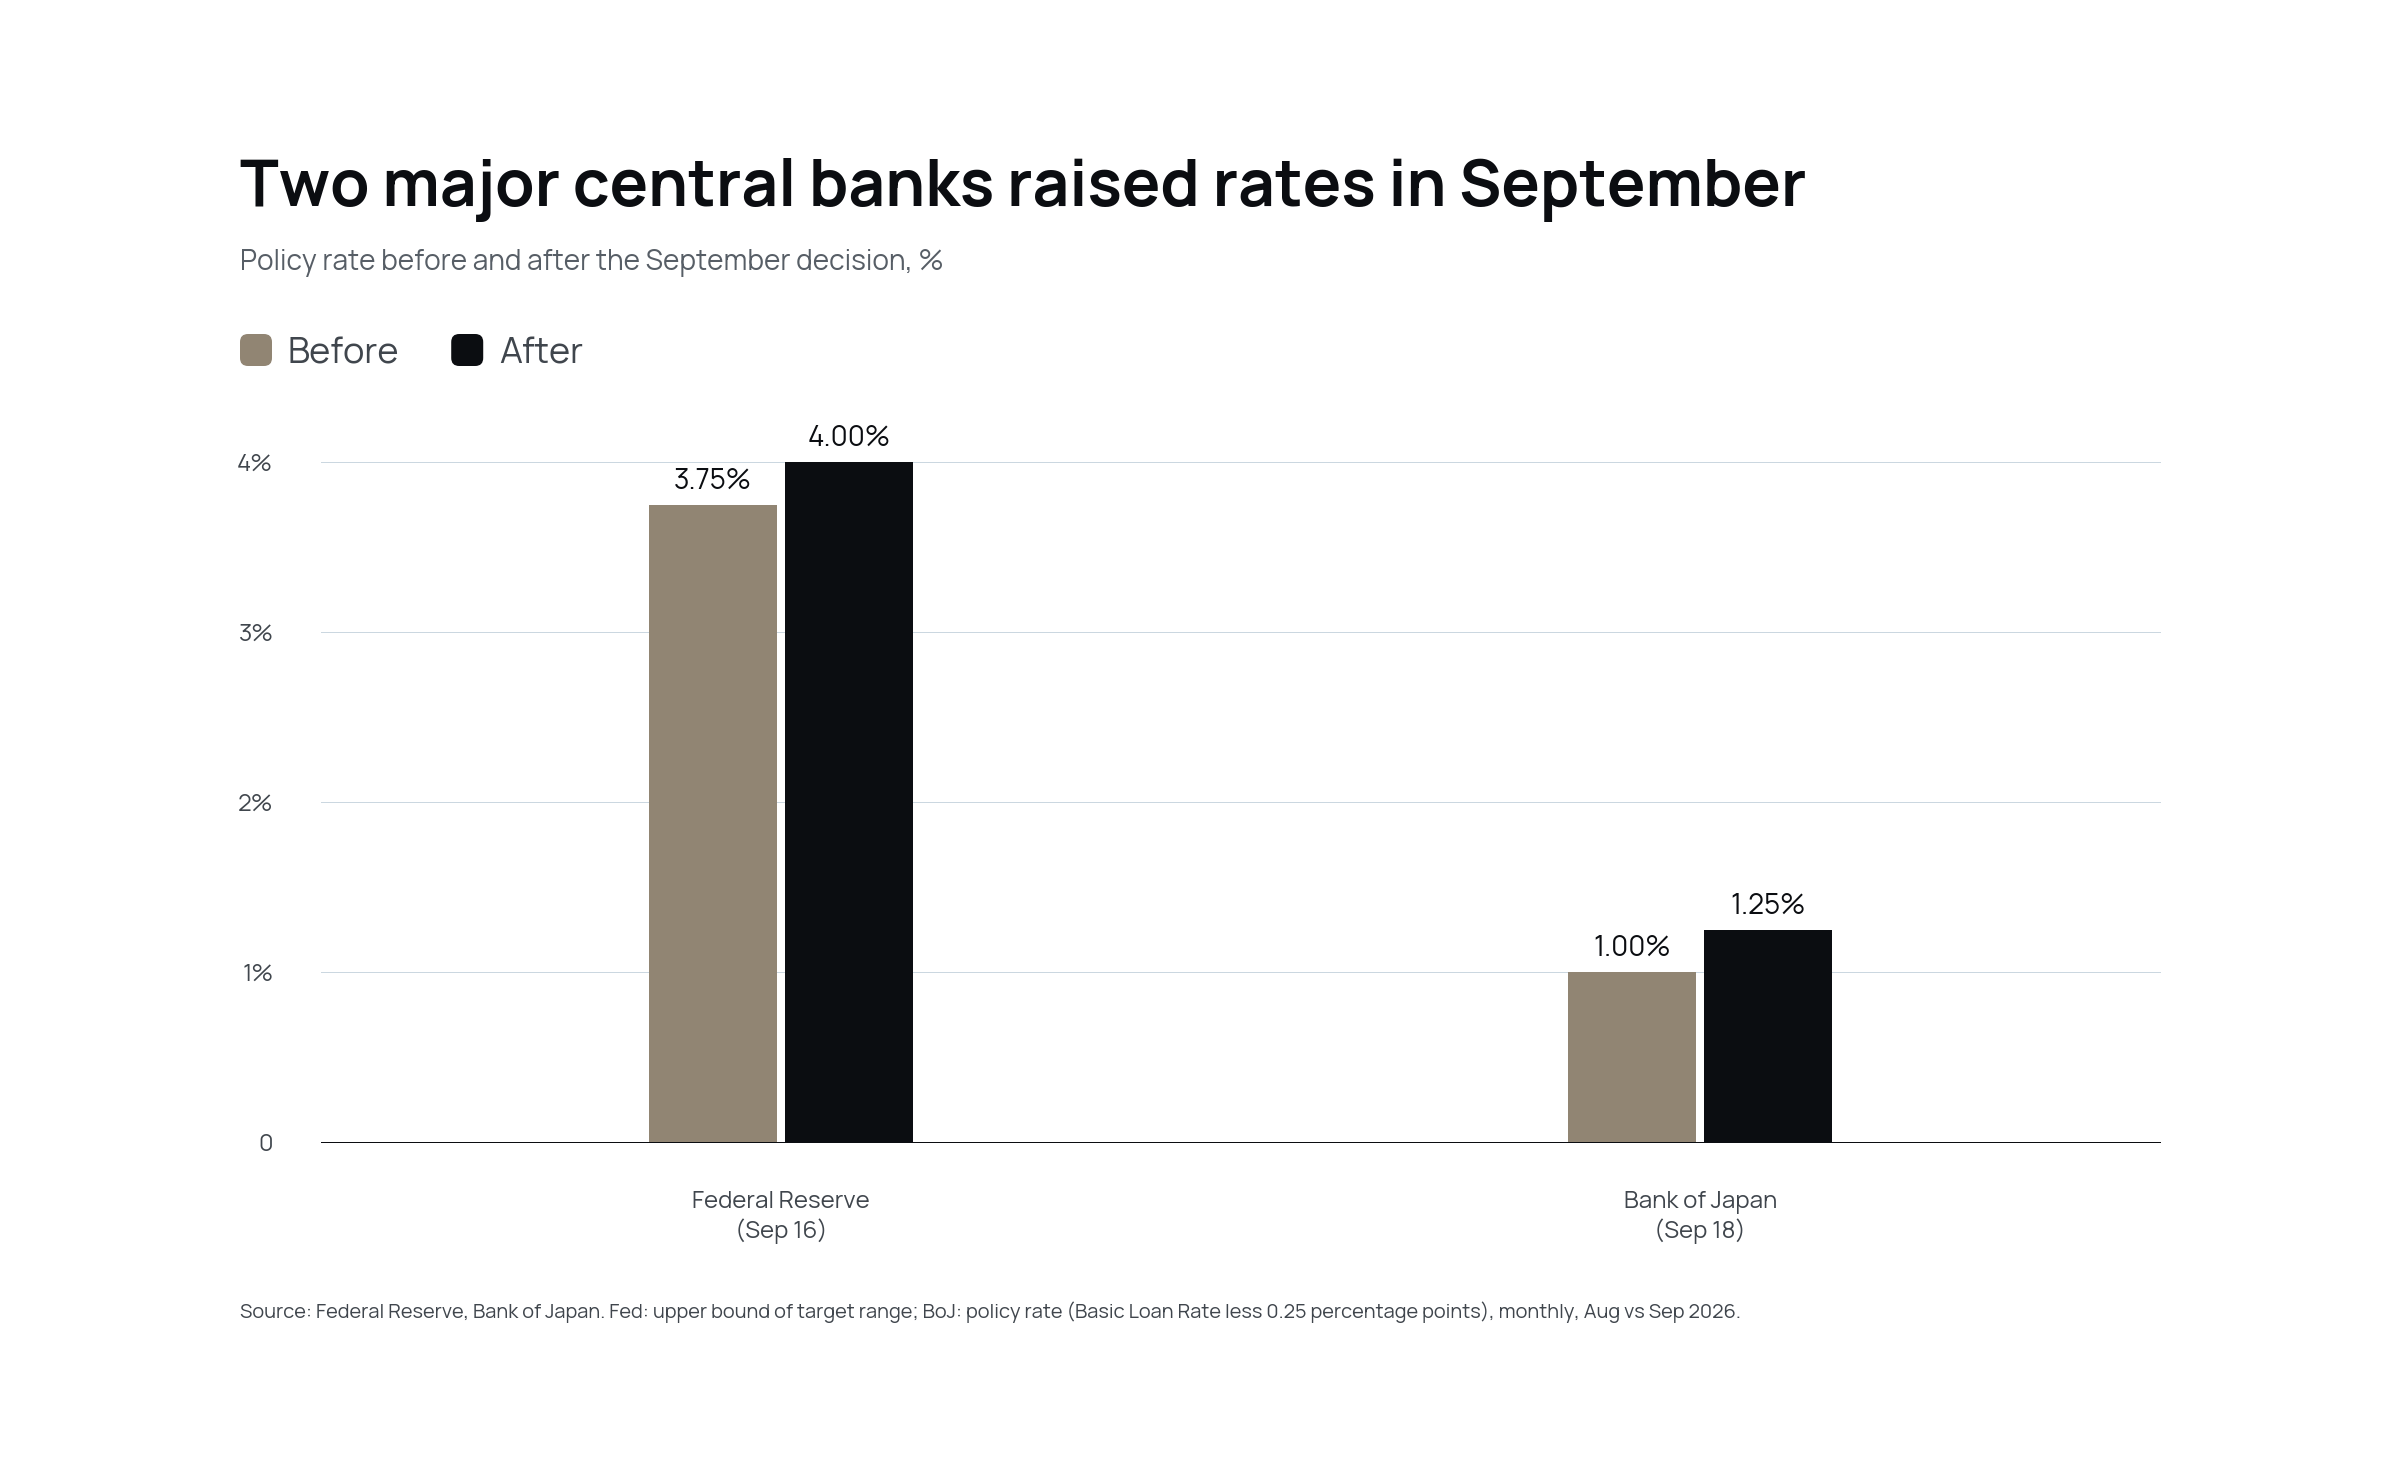
The Fed and the Bank of Japan both raised rates within two days. US data pulled in opposite directions: core PCE came in below expectations and hiring stalled, but energy-driven headline inflation and input prices kept rising.
- Inflation: US CPI 3.7% year on year in September (3.4% in August), up 0.6% on the month, with gasoline up 9.1% and energy up 20.4% over the year. Core CPI 2.6% (2.4% in August). Core PCE 3.0% against 3.3% expected.
- Labor and growth: Non-farm payrolls +162,000 in August, then +29,000 in September with unemployment at 4.2% against a 4.1% forecast. Q2 GDP revised up to 2.2%. ISM manufacturing 54.5, with prices paid at 77.9.
- Central banks: the Fed raised rates because inflation has stayed elevated and above its 2% target. Its projections point to one more hike this year (median 4.00–4.25%). The Bank of Japan moved to 1.25% on a 7–2 vote and did not commit to further hikes.
.png)
4. Risk Disclosure
This report is provided by Nexo to its private clients for informational purposes only. It does not constitute investment, financial, legal or tax advice, and it is not a recommendation, solicitation or offer to buy or sell any digital asset or financial instrument. Digital assets are highly volatile, and you may lose some or all of the capital you commit. Past performance is not a reliable indicator of future results.
Statements about the outlook, including market-mover assessments and scenarios, reflect Nexo’s views at the date of publication, are based on assumptions that may not hold, and are not forecasts or guarantees. Forward-looking statements and scenarios are not a reliable indicator of future performance. Data and figures come from third-party and company sources believed to be reliable but not independently verified, and may be revised. Nexo undertakes no obligation to update this report. Availability of Nexo products and services varies by jurisdiction.