Is the Bitcoin bottom near?
Jun 09•6 min read

In this patch of your weekly Dispatch:
- Big hands add ETH
- U.S. CPI arrives Wednesday
- SpaceX goes public
Market cast
BTC navigates a confluence of support
Bitcoin is consolidating near a confluence of key support levels, with technical indicators across both timeframes approaching oversold territory – a setup that warrants attention in the sessions ahead.
On the weekly chart, price has pulled back to the 200-period SMA, a key trend indicator currently acting as dynamic support, while simultaneously hovering near the lower Bollinger Band – a volatility indicator that marks the outer boundary of the current price range. Momentum indicators are sending a cautious signal: both the RSI and Stochastic oscillators are sitting right at the edge of oversold territory. Meanwhile, the MACD histogram – a trend and momentum indicator, manages to hold slightly above the zero line, a level worth watching closely.
On the daily timeframe, price is trading below most major SMAs, with trend indicators broadly reflecting the prevailing bearish pressure. However, momentum indicators are beginning to show early signs of a shift – both the RSI and Stochastic signal lines, while still in oversold territory, are trending upward, suggesting the selling pressure could be fading. The MACD histogram remains in negative territory and will need to reclaim the zero line to confirm any meaningful recovery.
Key levels to watch: Support sits at the immediate $63,000 level, with the next significant floor around $60,000. The 200-period weekly SMA also continues to serve as dynamic support on any further downside. To the upside, the first resistance to clear is around $64,000, followed by a more meaningful hurdle at the $68,000–$69,000 zone.
The big idea
Bitcoin: Near the buying zone?
We've held a hopeful view on Bitcoin's recovery for some time now. The macro environment had other ideas. May's nonfarm payrolls came in at 172,000 – more than double expectations, reinforcing a labor market that simply hasn't given the Federal Reserve reason to ease. Rate-cut hopes have since faded, with markets now pricing in a probability of rate hikes before year-end. Add to that the ongoing U.S.-Iran tensions keeping energy prices elevated, and the conditions for a sustained rally just haven't been there.
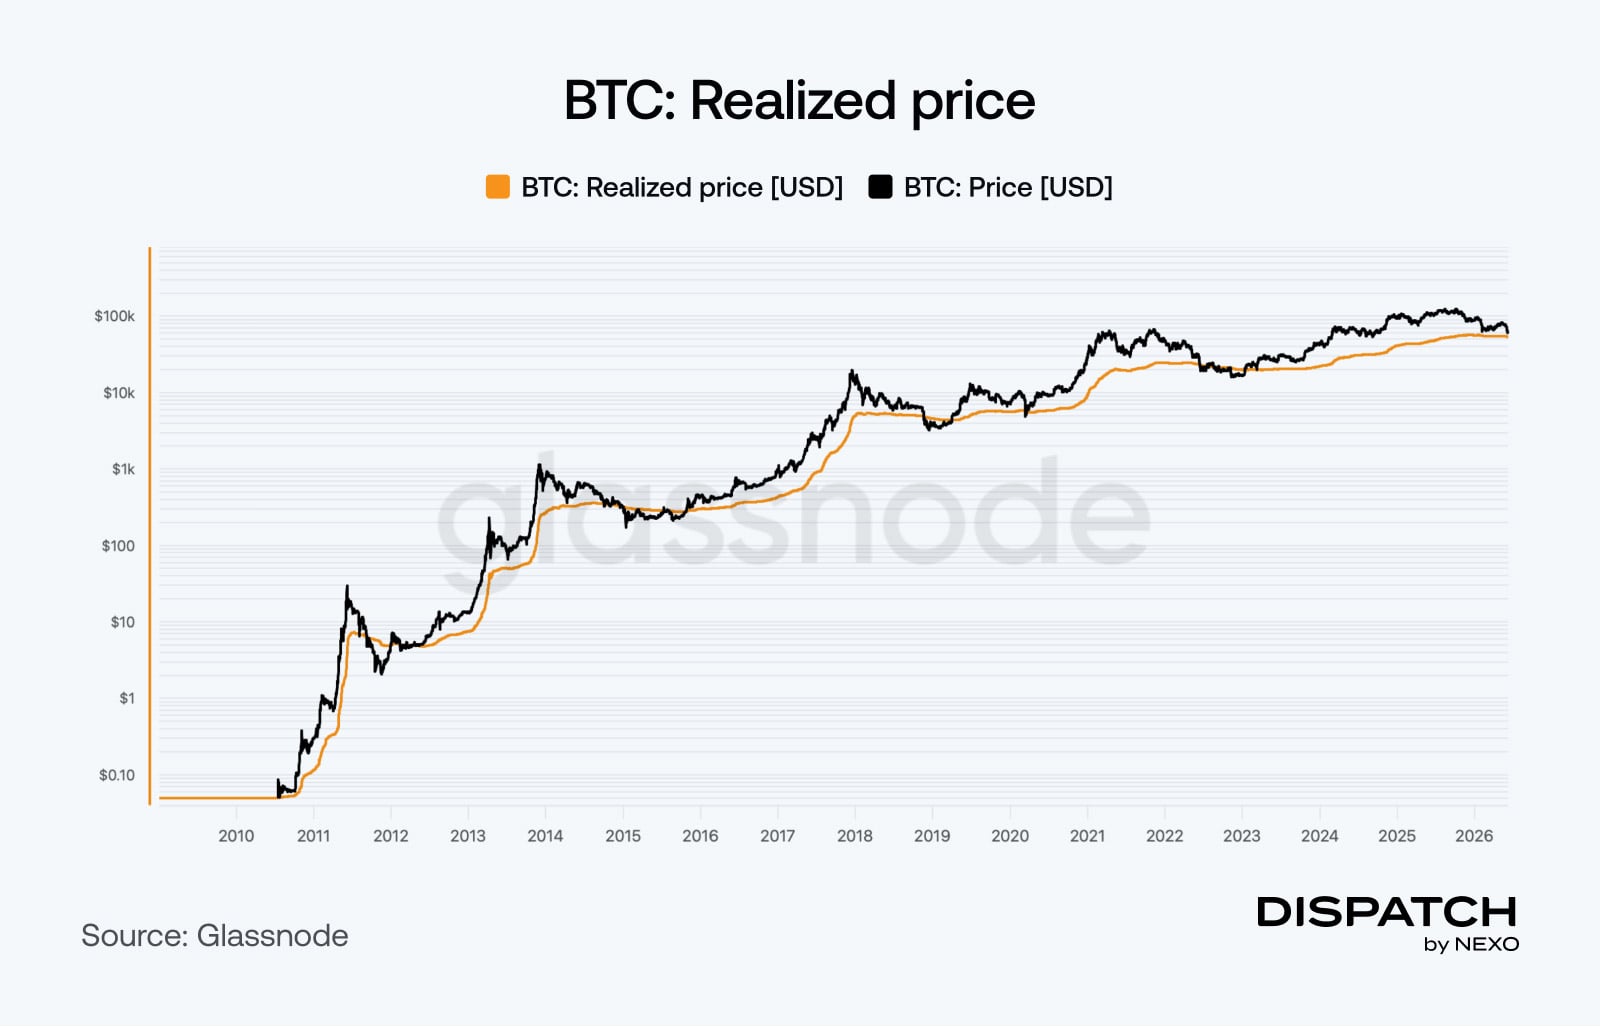
Beneath the macro noise, one on-chain signal is quietly approaching a threshold that has marked a turning point in every previous Bitcoin cycle. It functions less like a price target and more like a law of gravity. It's called the realized price – the average cost basis of every bitcoin in circulation, calculated from the last time each coin actually moved on-chain. Right now, that number sits around $54,000. Bitcoin has traded below it during every major bear market, and each time, it has recovered. With the market now down more than 22% over the past month, the realized price is coming into view. Head over to this week’s data story for the chart.
The past few weeks have seen meaningful pressure across the market. Bitcoin briefly dipped below $60,000 last week, as spot ETFs recorded $4.2 billion in outflows over three consecutive weeks. Beneath that, though, the data is beginning to look familiar. The 200-week moving average was touched last week at around $61,300, a long-term support level that has held through every previous cycle. On-chain capitulation metrics are at levels not seen since 2022. CryptoQuant founder Ki Young Ju notes that bear markets have typically ended near the realized price. Standard Chartered signaled the current range could come to be a "buying zone."
Bitcoin's recovery back above $63,000 over the weekend, analysts say, may be an early sign that sellers are running out of conviction. That doesn't make a recovery certain, or its timing predictable, but with so many on-chain signals aligned at historically significant levels, the ingredients for a cycle low are accumulating. Whether they've fully ripened is a question only time and price action can answer.
Ethereum
Signals under ETH’s pullback?
Ethereum fell more than 16% last week, briefly slipping below $1,600 as geopolitical tensions, a cautious Fed, and ETF outflows weighed on the broader market – a far cry from the $4,000 year-end target Standard Chartered floated in our last issue.
Beneath the decline, though, large wallets were quietly accumulating. The biggest cohort of whale addresses added roughly 290,000 ETH in the first week of June, while mid-sized wallets trimmed their positions, suggesting conviction is concentrated at the top end of the holder spectrum. Meanwhile, exchange reserves across major platforms fell by around 475,000 ETH. Coins leaving exchanges tend to signal holding intent rather than selling pressure for the same pattern emerging in Bitcoin: the hands most likely to hold through a cycle are the ones adding at these levels.
Macroeconomic roundup
Macro clarity or complexity – this week decides
Five releases, three central banks, and a U.S. inflation print that could reset expectations for the rest of the summer. This is the week the macro picture gets a little clearer — or a lot more complicated.
U.S. CPI (Jun 10): Headline expected at 4.2% YoY, up from 3.8%. The week's most market-moving release.
ECB Interest Rate Decision (Jun 11): Expected hike to 2.25% from 2.00%, signaling Europe's tightening cycle still has room to run.
U.S. PPI & Jobless Claims (Jun 11): Both PPI figures expected to ease; claims at 218K — steady and unlikely to shift sentiment.
U.K. GDP (Jun 12): Expected contraction of 0.1% MoM after prior growth of 0.3% — a further softening of the European economy.
TradFi trends
Gold stumbles, SpaceX goes public
SpaceX has priced its IPO at $135 per share, targeting a $75 billion raise at a $1.75 trillion valuation. For crypto markets, the listing is notable for one reason: SpaceX carries nearly 19,000 bitcoin on its balance sheet, bringing meaningful indirect BTC exposure into public markets for the first time.
Gold, meanwhile, has broken below its 200-day moving average for the first time since October 2023, slipping under $4,300 and into bear market territory. The move was driven by the same stronger-than-expected jobs report that pressured crypto – a reminder that macro forces move markets broadly, not selectively.
The week's most interesting data story
Where Bitcoin forms a bottom
As discussed in this week's big idea, the realized price is the metric worth understanding right now. The realized price – the average cost basis of every holder on the network, currently sits at $54,000. With spot prices near $63,000, the average Bitcoin acquisition is still sitting on an unrealized gain. In every previous bear market, Bitcoin has fallen to or below this level, and every time it has, it has recovered. What's telling about this cycle is that it hasn't happened once. That's not a guarantee of anything, but historically, it's exactly the kind of floor that long-term cycles are built on.
The numbers
The week’s most interesting numbers
$2.6 billion — Net ETF outflows year-to-date, but Bernstein says Bitcoin's "boring cycle" doesn't dent the store-of-value thesis.
4.59% — Bitmine bought 127,000 ETH for $207 million into the downturn, bringing its treasury to almost 5% of ETH's total circulating supply.
100 — The U.S. Dollar Index has crossed back above this level for the first time in two months, driven by May's blowout jobs report.
17 days – Ethereum ETFs had gone 17 consecutive sessions without a net inflow before finally reversing on June 4, pulling in $19.3 million.
$5.5 billion — The tokenized stocks market has grown 147% since January, as crypto-native investors increasingly seek equity exposure on-chain.
Hot topic
What the community is discussing
Visualizing the BTC bottom?
Doesn’t this show BTC is currently discounted?
Back to regular business.
Dispatch is a weekly publication by Nexo, designed to help you navigate and take action in the evolving world of digital assets. To share your Dispatch suggestions and comments, email us at [email protected].